2022 Precision Survey: As Ag Economy Shifts, So Does Technology Use By Retailers

Editor’s note: The CropLife/Purdue Precision Survey is the longest-running continuous study of precision farming adoption. The 141 agricultural retailer input supplier respondents mostly from the Midwest included cooperatives, independent retailers, and those part of a regional or national chain. Those answering as a farm equipment dealer or consultant in the first question were not allowed to continue further. The results reported are for dealers that identified as primarily working with field crops such as corn, soybeans, wheat, rice, cotton, milo, sugar beets, and forages. Dealers that work with specialty crops such as tree fruits and nuts, vegetables, berries, and grapes are analyzed separately.


View all
2022’s Precision Agriculture Dealership Survey shows shifting technology use, concurrent with the dramatic swings in the prices of agricultural products and in the costs of growing crops. Dealers have invested in technology to streamline their logistics, such as fleet management and telemetry. More dealers are planning future customer offerings of variable rate pesticide applications, applying crop inputs with drones, using chlorophyll/greenness sensors, and making soil electrical conductivity (EC) maps. On-farm data is used the most for fertilizer-related decisions, and fertilizer-related offerings continue to provide greater returns than other services. The cost of the technology relative to the value gained in time or inputs mostly determines the return to precision investment. So, when the cost and availability of labor, pesticides, fertilizers, and other inputs as well as crop prices grows faster than the cost of electronics and controllers to manage all that, the case for investment in digital ag can be more readily made.
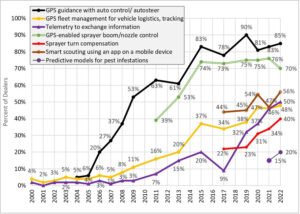
Dealers have long used precision technology in their own operations. Eighty-five percent of dealers use autoguidance on their application equipment (Figure 1), and 91% of those who offer precision services use guidance of any type (including manual guidance/light bars). This hasn’t changed much in recent years — and some year-to-year variation of survey results is normal, as survey respondents differ each year. GPS-guided boom section/nozzle controllers on sprayers, which reduce doubling-up and skips, are used at 70% of dealerships and sprayer turn compensation continues to grow, now at 40%. To help with their operational efficiency, and to ensure accurate work, half of dealers are using telemetry to exchange information among applicators or to/from office locations, sharply increasing over the last decade. About half are using GPS fleet management to track the locations of vehicles and guide vehicles to work sites, also up over previous years.
Growing Interest
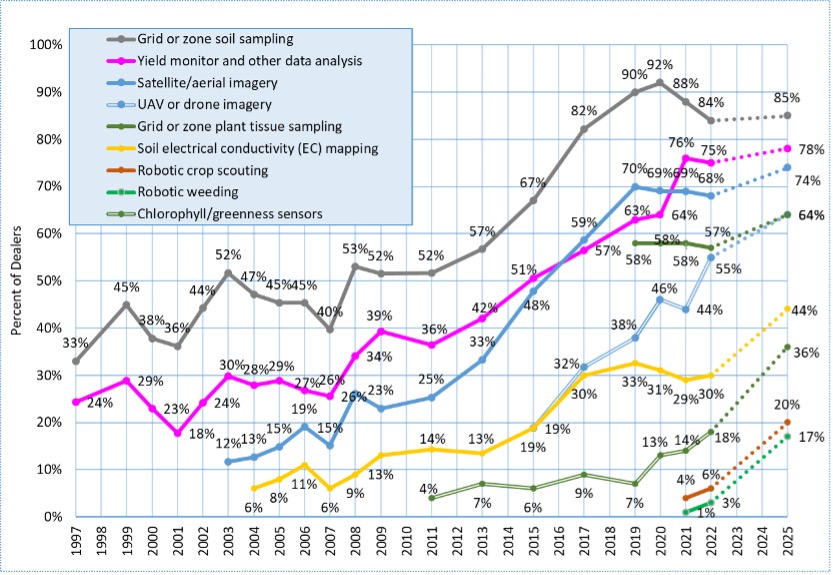
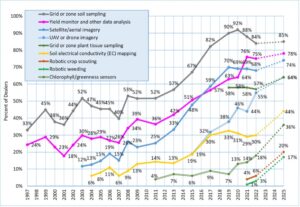
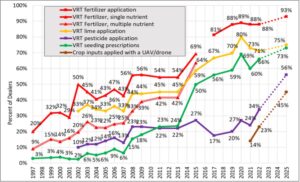
Over the years there has been an ever-changing mix in the precision products and services dealers offer to their customers. Following a decade of very slow growth, a big upswing in many precision offerings occurred in the decade from around 2011 to 2020 (Figures 2 and 3). More than two thirds of dealers now offer precision soil sampling, yield monitor analysis, satellite or aerial imagery, VRT fertilizer and lime applications, and VRT seeding prescriptions. Lower in adoption but on an upward trajectory is the use of chlorophyll/greenness sensors, a tool directly aimed at fertilizer efficiency, and twice as many dealers say they will be offering this service three years out as are offering it today. Soil EC mapping has been up and down over the years, but 14% of dealers say they will be adding these services in three years. Seed price changes and shortages have not been as acute as with fertilizers and pesticides. The percentage of dealers offering VRT seeding prescriptions has leveled off in the last three years, compared to a substantial upward burst in the four years prior (2013 to 2017), and 7% of dealers plan to add this service by 2022.
One of the biggest areas of growth anticipated by retailers is high-tech pest management. About a third of dealers now offer VRT pesticide applications, but more than half say they will be doing this in three years. About a quarter of dealers indicate they now use a drone for some pesticide applications, but almost half say they will be doing this in three years (Figure 3). Early in the game are robotic weeding and robotic scouting. Only a few dealers responded that they are offering these now, but 17% and 20% of dealers, respectively, said they would be offering these in three years, by 2025, showing great confidence in their potential (Figure 2). But comparing estimated future use of many practices in past surveys with the actual results three years later, it is common for dealers to overestimate. The interest in precision pest management might be driven by pesticide costs and availability, as well as continued pest resistance issues.
Eyes in the Sky
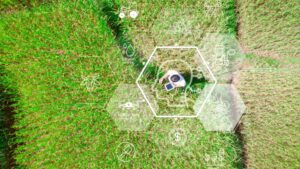
Imagery still seems to be seeking its place in farm management decisions — over 50 years in the making since multi-spectral satellite and aerial imagery first became available in the 1960s. Two decades ago few dealers offered satellite or aerial imagery, but there has been a steady increase since, now at over two thirds of dealers but plateauing in the last three years. We started asking about drone imagery just eight years ago, and since then it has grown from 19% of dealers offering to 55% today. Many dealers who do not now offer are planning to add aerial/satellite or drone imagery. The ease with which drones can be flown and images georeferenced and stitched compared to just a few years ago are certainly contributing factors.
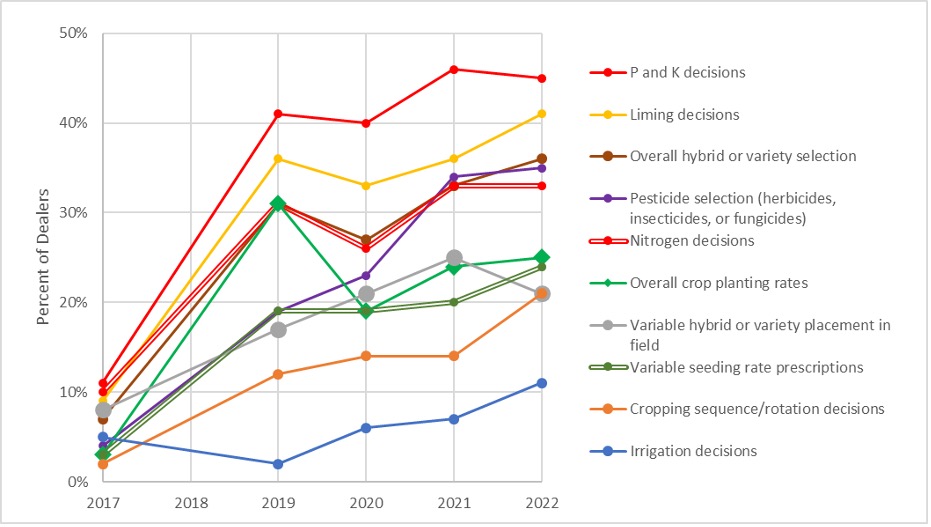
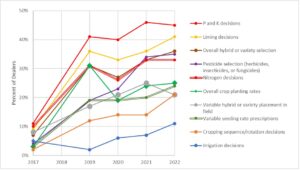
There has been a remarkable uptick in crop management decisions from pooled data in recent years (Figure 4), but no notable changes compared to 2021. We define pooled data as that which is aggregated from multiple farms, either managed within the dealership or as part of an outside offering. Forty-five percent of dealers said phosphorus and potassium decisions were majorly influenced by pooled data, similar to what we saw last year but quadrupled compared to five years ago, and a third saying nitrogen decisions were heavily influenced by data. Fewer dealers relate the importance of on-farm data for planter decisions — 36% of dealers indicate a major influence for overall hybrid/variety selection, 25% for overall planting rates, 24% for informing variable planting rate prescriptions, and 21% for variable hybrid placement. Looking at the numbers for data having at least some influence on the decision (data not shown), 86% said this for P and K decisions, 85% for N, 80% for overall hybrid/variety selection, 75% for overall planting rates, 68% for planting rate prescriptions, and 78% for variable hybrid placement. Sixty-four percent of dealers say their organization has a customer data privacy statement and/or data terms and conditions agreement, steadily up since 45% in 2017.
Fertilizer Service
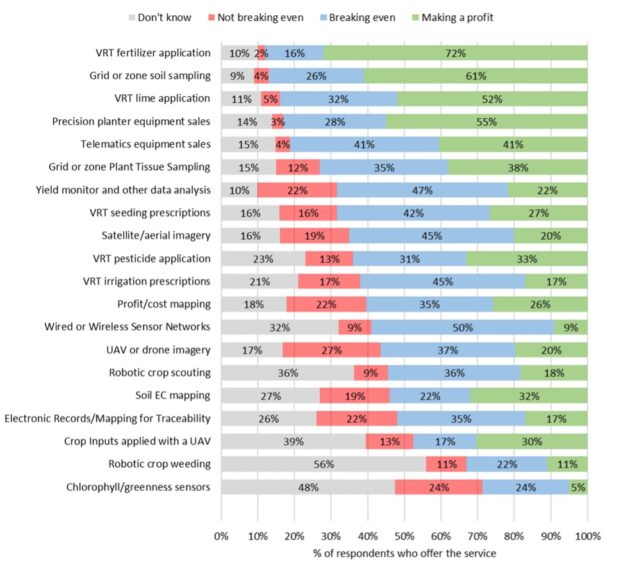
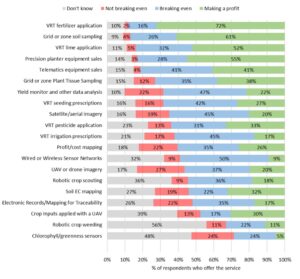
Grid/zone sampling and VRT fertilizer applications continue to be the most profitable for dealers (Figure 5). The percentage of dealers indicating these fertilizer-related services return net positive revenue has roughly doubled in the last 20 years, and during that time these have been consistently more profitable than other offerings. Much less profitable are imagery offerings, whether that be drone, aerial, or satellite. Just 27% of dealers say creating seed prescriptions for their farmer customers results in a profit, and just 22% of dealers say yield monitor and other data analysis is profitable.
The survey also asked dealers to estimate the technology use by their farmer-customers (data not shown), and there were few notable changes compared to 2021. The dealers say autoguidance, spray section controllers, planter controllers, yield monitors, grid or zone soil sampling, and VRT liming are used on most of the acres in their trade areas. Fertilization is variable rate on 49% of acres, 31% use aerial or satellite imagery, and 22% VRT seeding, all similar to the last few years. Some notable increases in the last five years were in planter variable down pressure, going from 14% in 2017 to 41% of acres now, drone imagery 6% to 17%, and the use of any type of data analysis service, from 13% to 38%. It is interesting that going back 20 years, the percentage of acres receiving grid or zone sampling was always higher, normally by a few points, than the percentage of acres receiving VRT fertilizers, indicating that not all acres with precision sampling follow up with a precision application.
Subscribe Today For