Phosphate and Potash Outlook 2019
Phosphate and potash prices continued to march higher in 2018, although phosphate prices experienced some weakness late in the year on typical seasonal demand softness. Several overarching factors that had boosted prices in 2017 remained in play last year. Global shipments of the leading P&K products once again reached record levels, much-anticipated greenfield projects delivered fewer tons than advertised, and elevated raw materials costs provided an additional push to phosphate prices.
While price momentum stalled in Q4 2018 (and, in the case of phosphate, reversed course), the question remains as to whether last year’s macro trends that resulted in higher prices will persist in 2019, or have fundamentals changed? Our take is that the supply and demand situation continues to point toward a relatively balanced market — in other words one in which P&K prices hold 2018’s gains, with limited risk to both the upside or downside other than typical seasonal fluctuations. Several swing factors, such as where agricultural commodity prices settle, how quickly new capacity ramps up, and Chinese phosphate export availability, will ultimately shape the outlook.
Potash
Wholesale granular muriate of potash (MOP) prices started 2018 by trading at about $235 per ton free on board (fob) New Orleans (NOLA) barge and moved continually higher before closing the year a bit shy of $300 per ton. While this circa $65 per ton increase appears impressive, potash prices in the U.S. continued to lag behind other global benchmarks. For example, the price of MOP delivered to Brazil ended the year at about $320 per ton after posting a similar increase over the course of the year.
Tight global supply/demand fundamentals drove the gains in global benchmark prices. Despite the big jump in global MOP shipments in 2017 (a 5 million metric ton or 8% year-over-year increase), prompting some analysts to predict a dropoff in 2018, we instead witnessed moderate shipment growth. Our latest estimate shows global shipments grew by nearly 2% to 67 million metric tons, with most regional markets around the world posting flat to higher demand figures. On the supply side, the ramp-ups of greenfield projects in Canada, Russia, and Turkmenistan fell well short of market expectations.
At this time last year German potash supplier K+S was indicating that its Bethune facility in southern Saskatchewan was expected to produce 1.7 million metric tons in 2018, but our market intelligence suggests that actual volume fell short of that total by perhaps half a million metric tons. Guidance from K+S in November was for 1.7 to 1.9 million metric tons KCl production in 2019. In Turkmenistan expectations were that the new Garlyk facility would produce more than 700,000 metric tons in 2018, while production is unlikely to top 50,000 metric tons (Q1-Q3 2018 production was reported at just 24,000 metric tons). In Russia EuroChem continues to develop its two world-scale projects — the Usolskiy facility in the Perm region (home to Uralkali’s operations) and the Volgakaliy project in the Volgograd region of southern Russia. Combined, we expect the mines will have produced around 300,000 metric tons in 2018 vs. a year-ago guidance of 500,000 metric tons (and expectations by some analysts of upward of 1 million). Management indicated in November that combined production in 2019 was forecast to be 1.1 to 1.4 million metric tons. Combined, the above ramp-ups in Canada, Turkmenistan, and Russia delivered approximately 1.5 million metric tons less than expected. Note that the “lost” production from these ramp-ups was similar in magnitude to global demand growth in 2018.
Elsewhere in Russia, Uralkali’s established Solikamsk-2 mine suffered from new water inflow issues in 2018, which is believed to have negatively impacted production at that mine, and there is elevated risk of further disruption in 2019.
As it is likely that there will be meaningful production volume improvement from the aforementioned greenfield projects in 2019, particularly in Canada and Russia, the fundamental argument for continued firm or higher prices this year therefore hinges on the assumption that demand growth will be adequate to absorb these supplies.
Our baseline potash demand forecast shows shipments posting modest growth this year, as the price increases of 2018 begin to curb demand growth at the margins, particularly given the current subdued price environment in agricultural commodity prices. In markets like the U.S., channel inventories are starting 2019 at elevated levels, a function of the below-average fall application season. Offsetting this are inventories believed to be average or below-average in most other parts of the world. Moreover, despite continued general weakness in ag commodity markets, on-farm demand looks solid, as farmers look to replace the nutrients removed from recent record harvests.
Our crop nutrient affordability metric, the ratio of a crop nutrient price index and a crop price index, is pointing to fairly average affordability now. As a result, we forecast that global MOP shipments will increase to 67 to 69 million metric tons KCl this year. Our point estimate remains in the middle of that range, up nearly 2% or about 1 million metric tons from last year. In North America we project that shipments will hold broadly flat from around 10 million metric tons in 2018, with our projection of a big spring season to offset last year’s poor fall. This forecast assumes that U.S. farmers will plant around 92 to 94 million acres of corn (up 3 to 5 million acres vs. last year), 84 to 86 million acres of soybeans (down 3 to 5 million), and 48 to 50 million acres of wheat (up 0 to 2 million) this year. Application rates are expected to remain steady. Demand is expected to continue its trend higher in those markets that have been the principal driver of demand growth in recent years, particularly Brazil, where the ag sector continues to benefit from a relatively weak currency and the effects of the trade dispute between the U.S. and China bolstering demand for Brazilian ag products. Countering this will be markets like India, where the relatively low subsidy support for potash, coupled with higher potash prices, are likely to crimp direct application demand.
The bottom line is that the supply and demand math looks balanced to tight in 2019, particularly in the first half of the year, as the greenfield projects continue their slow ramp-ups. Demand is expected to grow about 1 million metric tons this year, while net incremental supply changes add up to an increase of about 700,000 metric tons. Furthermore, the combination of front-loaded shipments and closures (e.g., K+S Sigmundshall in Germany permanently closed in December 2018, reducing 2019 supply by about 450,000 metric tons vs. last year) and back-loaded ramp-ups point to the potential of a tight situation during the first half.
Phosphate
The diammonium phosphate (DAP) price fob NOLA barge moved up from the low $360s per ton at the beginning of 2018 to the low $420s per ton during the fall season, before softening to around $385 per ton by year end. We believe that the drop in prices in Q4 2018 was a typical seasonal price softening, exacerbated by a poor fall fertilizer application season in North America, as weather delays slowed harvest progress and fall fieldwork. In addition, Chinese phosphate exports in the fourth quarter beat expectations, adding to global availability.
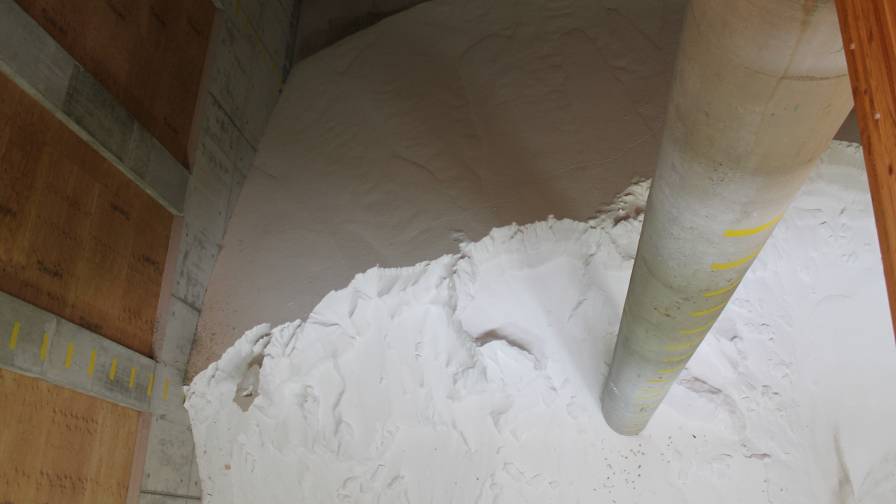
The fundamental driver of the rebound in phosphate prices and stripping margin in 2018 was the relatively tight supply/demand balance in play.
The stripping margin, or the difference between the DAP price and the cost of sulfur and ammonia per ton of DAP, also rose in 2018, from about $225 per ton to start the year to as high as $275 in Q3 before retreating to just shy of $250 by year end. That $250-per-ton threshold is important, as that is perceived by many market analysts as the minimum threshold required to keep the global phosphate industry economically sustainable. Decisions taken to idle or close phosphate capacity in recent years were taken as the industry saw the stripping margin remain mired in a trough of $200 to 225 per ton for most of 2016 and 2017.
The fundamental driver of the rebound in phosphate prices and stripping margin in 2018 was the relatively tight supply/demand balance in play. On the demand side of the ledger, growth remained robust despite China continuing to act as a significant drag. After growing at a modest compound annual rate of 1.5% from 2010 to 2015, we estimate that global shipments of the leading solid phosphate products (DAP, MAP [monoammonium phosphate], NPS [ammonium phosphate-sulfate], and TSP [trisodium phosphate]) increased at an average rate of 2.0% per year over the past three years, hitting 70 million metric tons in 2018. This was despite demand in China, the world’s largest phosphate fertilizer market, dropping by more than 5% per year during the 2015-18 period, or about 3 million metric tons in total. Offsetting the demand contraction in China were extraordinary demand gains in a host of markets around the world, most notably in other parts of Asia and in Latin America.
On the supply side of the ledger, there were two sizable year-over-year downward adjustments in actual and expected availability. First off, the idling of Mosaic’s Plant City (FL) facility in December 2017 meant that global supply in 2018 would have an approximately 1.3 million metric ton deficit to fill relative to 2017. Market expectations called for the ramp-ups of new capacity in Morocco and Saudi Arabia to offset this lost supply, as well as meet new demand growth, but these new supplies were much slower to ramp up than expected. We believe that the ramp-ups underperformed vs. expectations by over a million metric tons. The most pointed example was the Ma’aden Wa’ad al Shamal Phosphate Company (MWSPC) joint venture plant in Saudi Arabia. The 3 million metric ton facility was commissioned in mid-2017, producing a bit less than 500,000 metric tons. Most analyst expectations for 2018 were calling for 2.0 to 2.5 million metric tons of production, while actual output came in short of 1.5 million. The shortfall, much of which would have served stepped-up Indian imports, supported the phosphate price rally through the first three quarters of the year, which in turn facilitated a rebound in Chinese phosphate exports that otherwise would likely have declined due to new environmental taxes and regulations driving up costs there.
Raw material cost pressure also added support to phosphate fertilizer prices. The benchmark code of federal regulations (cfr) Tampa sulfur price rose from an average of $82 per long ton in 2017 to $123/long ton (lt) in 2018. This $41/lt increase added about $15 to the cost of producing a ton of DAP. Global ammonia prices were also higher year-over-year, with the cfr Tampa benchmark rising $32 per metric ton to $313, adding about $6 to the cost of producing a ton of DAP.
Shipment prospects look solid again this year for the same reasons described in the potash section — still OK global agricultural economics and the agronomic need to replace record nutrient removal. We forecast that global shipments of high-analysis phosphate products will climb about 1.2 million metric tons to about 71 million in 2019, although some building of inventories in Q4 2018 (e.g., in India) have the potential to act as a drag on global shipment growth this year. The rest of Asia, however, is expected to post another gain this year, as are shipments in Brazil and the rest of Latin America. North American shipments are expected to be broadly flat at around 10 million metric tons.
As with potash, the bottom line is that the supply and demand math points to a relatively balanced supply/demand balance, provided that demand growth continues to hold. Phosphate shipments are expected to increase by over a million metric tons in 2019. Assuming no change in Chinese exports, net supply increases add up to around 1.5 million metric tons, which given our modest demand growth assumptions would point to a market in slight surplus relative to last year. But with Chinese exports having risen by about 1 million metric tons in 2018 to over 11 million as they deferred supplying their domestic market in Q4, we believe that export volumes are likely to moderate in 2019 as they restock their domestic channels.
Key Swing Factors
As usual, one of the key swing factors is agricultural commodity prices. The Southern Hemisphere is poised again this year to harvest another big crop, although it’s looking smaller than many of the earlier estimates. If the Northern Hemisphere produces another big crop as well later in the year, agricultural commodity prices could take a step down and jeopardize P&K demand. In addition, there are growing concerns about global economic growth, exacerbated by trade disputes like that between the U.S. and China, which could curb demand for agricultural commodities and contribute to price weakness.
The speed at which greenfield capacity ramps up will also remain a swing factor. As noted above, new P&K facilities underperformed expectations in 2018 and could do so again in 2019, although the uncertainties are probably more acute with regard to potash. For phosphates, the biggest supply swing factor is expected to be export availability from China. As mentioned, exports in 2018 outperformed expectations as strong demand from India and higher global prices offset the impact of new and more stringent Chinese environmental policies, while deferred domestic demand absorbed fewer metric tons. While the new environmental policies did not curb phosphate fertilizer exports as occurred with regard to nitrogen exports, raw material phosphate rock production has been curtailed. If these limitations on rock production persist (or worsen) in 2019, it is difficult to envision Chinese phosphate fertilizer exports being maintained at 2018 levels.


