Phosphate and Potash Outlook 2018
 February 19, 2018
 Phosphate and potash prices trended upward throughout 2017. Several factors combined to move prices higher last year. Global shipments of the leading P&K products climbed to record levels. Much-anticipated greenfield projects delivered fewer tons than advertised. Following the collapse of P&K prices in 2015/16, some North American producers permanently closed or temporarily idled high-cost facilities. And a surge in raw materials costs pushed up phosphate prices.
Price momentum has carried over into the first weeks of the New Year. So, will this trend persist through 2018, or will fundamentals change at some point this year? Our take is that the supply and demand situation continues to look constructive at least through the first half of the year. Several swing factors such as how quickly new capacity ramps up, where agricultural commodity prices settle, and the impact of new environmental policies in China will shape the outlook later this year.
Potash
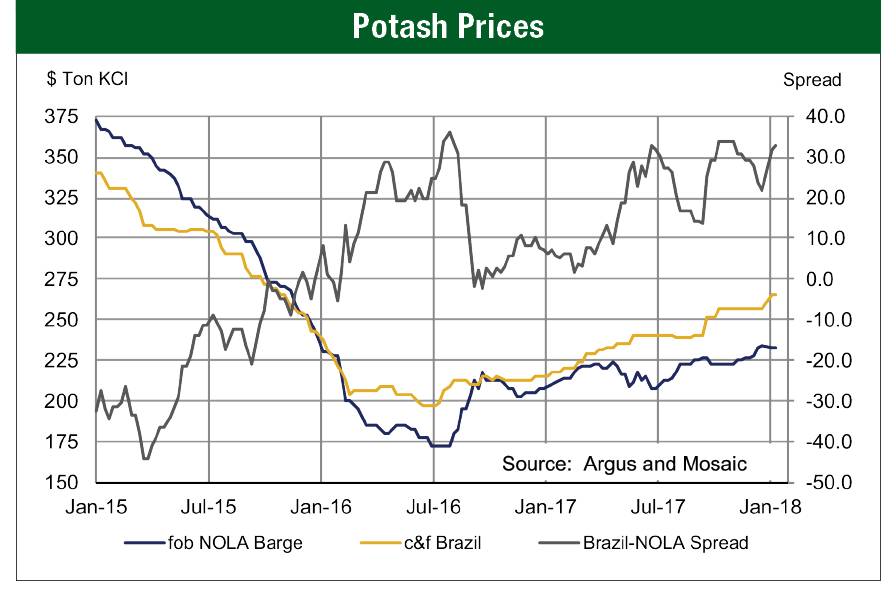
The price of blend grade potash traded at $235 per ton fob NOLA barge at the end of 2017, up about $25 from a year earlier but still off almost 40% from the price at the start of 2015. Gains last year in the United States, however, lagged increases elsewhere. For example, the price of blend grade product delivered to Brazil ended the year at about $265 per ton, up $70 from January 2017.
One argument for higher prices, at least in the United States, is that the large gap between prices in Brazil and the United States is expected to narrow this year. Producers likely will direct more tonnage into higher netback regions rather than continue to dump product into the United States. Strong fundamentals point to the U.S. price increasing rather than the Brazil price decreasing in order to narrow the gap. The recent announcement of a $20 per ton increase in North American prices has begun to narrow this gap.
However, the fundamental argument for firm or higher prices this year hinges on the assumption that continued strong demand growth will absorb supplies from the ramp-up of new facilities. Demand is a great story. The jump in global shipments clearly was the main driver of price increases last year. After reviewing the most recent production and trade statistics, we now estimate that global potassium chloride shipments surged 7% or 4.2 million tonnes to a record 65.0 million tonnes KCl last year. This swamped our initial forecast of a 4% or 2.5 million tonne increase that was cited in this outlook article last year.
Each major consuming region posted a big gain in 2017. Asia accounted for more than 60% of the surge. Brazil registered a 900,000 tonne increase. In North America, we estimate that shipments increased about 400,000 tonnes to 9.8 million tonnes, at the top end of the range for domestic shipments. North American producers shipped about 7.9 million tonnes into their home market while imports from offshore producers spiked to a record 1.9 million tonnes in 2017, shattering the previous high water mark of 1.5 million tonnes in 2011.
Shipments are expected to increase again this year despite the big jump last year. Some analysts are concerned that 2017 stole tonnage from 2018. That is a legitimate concern, and demand no doubt was pulled forward in some regions. However, based on feedback from the field, our assessment is that channel inventories in most countries are at average or even below-average levels at the start of 2018. On-farm demand continues to look solid. Record harvests have removed record amounts of potassium from farm fields around the globe, and the numbers suggest that farmers are maintaining or rebuilding soil potassium levels, particularly during this window of low potash prices. Economic drivers, while not as strong as a few years ago, still look OK for most crops and in most geographies. Our affordability metric, the ratio of a crop nutrient price index and a crop price index, is pointing to average affordability right now.
As a result, we forecast that global MOP shipments will increase from 65 to 67 million tonnes KCl this year. Our point estimate is 66.4 million tonnes, up 2% or 1.4 million tonnes from last year. In North America, we project that shipments will drop from 9.8 million tonnes in 2017 to 9.5 million this year due to a big application season last fall and a spurt of year-end purchases by many distributors. This forecast assumes that U.S. farmers will plant 89.5-90.5 million acres of corn, 91-92 million acres of soybeans and 45-46 million acres of wheat this year. Application rates are expected to remain steady.
On the supply side of the ledger, greenfield projects delivered less tonnage than expected last year. K+S indicated that its Bethune facility in southern Saskatchewan was expected to produce 500,000 tonnes KCl in 2017, down from a prior estimate of 600,000 to 700,000 tonnes. Management also indicated that the operation is expected to produce 1.7 million tonnes in 2018. Compactors were not scheduled to start up until late last year so no blend grade product was available for the U.S. and Brazilian markets in 2017. A recent freight fixture to Brazil indicates that compactors are now operating.
In Russia, EuroChem is developing two world-scale projects — the Usolskiy facility in the Perm region (home to Uralkali operations) and the Volgakaliy project in the Volgograd region— but these operations did not deliver any tonnage in 2017. Management indicated that combined capacity is expected to reach 1.1 million tonnes KCl in 2018, but highlighted that production likely will total only 500,000 tonnes this year. The EuroChem Usolskiy mine was expected to start up late this year, but industry publications reported in early January that the company announced that start-up was pushed back to March. The Volgakaliy project is not expected to begin commercial production until later this year or early in 2019.
The bottom line is that the supply and demand math looks balanced for this year, even with aggressive assumptions about the ramp-up of new capacity. Demand is expected to grow 1.4 million tonnes this year. Net supply changes add up to an increase of about 1.5 million tonnes. Changes include the shutdown of MOP production at ICL’s Boulby mine (-0.2 million), a ramp-up of K+S Bethune (+1.2 million), and the start-up of EuroChem mines (+0.5 million). Furthermore, the combination of front-loaded shipments and back-loaded ramp-ups points to the potential of an increasingly tight situation during the first half of 2018.
Phosphate
The DAP price fob NOLA barge moved up from the low-$300s at the beginning of 2017 to $365 per ton by year end. However, the stripping margin, or the difference between the DAP price and the cost of sulfur and ammonia per ton of DAP, remained mostly flat in a range from $200 to $225 per ton throughout 2017. DAP price increases just kept pace with surge in raw materials costs last year.
So, one of the arguments for firm to higher phosphate prices is that improving fundamentals have not yet resulted in higher stripping margins. Assuming fundamentals stay constructive, the stripping margin is expected to widen this year as a result of higher phosphate prices and steady raw materials costs, or steady phosphate prices and lower raw materials costs, or some combination of both.
Phosphate fundamentals continue to look constructive due to a pick-up in global demand growth, supply adjustments mostly in the United States, and slower than expected ramp-ups of new capacity in Morocco and Saudi Arabia.
The pace of demand growth clearly picked up last year. After growing at a low compound annual rate of 1.6% from 2010 to 2016, we estimate that global shipments of the leading solid phosphate products (DAP/MAP/TSP/NPS) increased 3.0% or 2.0 million tonnes to 68.3 million in 2017. Gains were broad-based, but Asian countries excluding China accounted for more than one-half of the increase while Brazil accounted for another 25%. North American shipments also increased about 300,000 tonnes to 9.7 million, at the top end of the historical range.
Shipment prospects look solid again this year for the same reasons described in the potash section — namely positive agronomic and economic demand drivers. We forecast that global shipments of these products will climb another 2.4% or 1.6 million tonnes to 70.0 million in 2018. India is expected to have big needs and enter the market early as a result of continued strong on-farm demand as well as depleted inventories throughout their entire supply chain from import terminals to the thousands of small retail shops. The rest of Asia also is expected to post another gain this year, albeit smaller than the big jump last year. Brazil shipments are forecast to continue their upward trend powered by steady soybean prices and the likelihood of a bit weaker real. In North America, shipments are projected to drop back to 9.5 million this year as a result of the big application season last fall as well as large year-end positioning for 2018.
On the supply side of the ledger, significant adjustments have occurred and more are likely this year, particularly in China where the government is implementing new environmental regulations. In the United States, Mosaic announced on October 31 that it planned to temporarily idle its Plant City facility by January 1, 2018. This facility typically produced about 1.5 million tonnes of DAP/MAP per year.
New capacity also is ramping up more slowly than expected. The market is closely watching two start-ups — the Ma’aden Wa’ad al Shamal Phosphate Company (MWSPC) joint venture in Saudi Arabia and Jorf Phosphate Hubs 3 & 4 (JPH 3 & JPH 4) in Morocco. The MWSPC joint venture began production in July and produced about 450,000 tonnes of DAP in 2017. However, that was less than one-half of its initial plan of 1.0 million tonnes. We expect production will ramp up to 1.5-2.0 million tonnes in 2018.
In Morocco, the JPH 3 granulation plant reportedly started up last spring and the phosphoric acid plant started up late last summer, about six months later than expected. JPH 4 was scheduled to start up late last year, but industry publications have reported that commissioning now is not expected until the second quarter of this year. We expect incremental supply of about 1.0 million tonnes from these two facilities in 2018.
The bottom line is that the supply and demand math continues to look constructive. Demand is expected to grow 1.6 million tonnes this year. Assuming no change in Chinese exports, net supply increases add up to about 1.0 million tonnes. Changes include the temporarily idling of Plant City (-1.5 million), the ramp-up of MWSPC (+1.5 million), and the ramp up of JPH 3&4 (+1.0 million). This implies that the global operating rate will need to tick up a notch or two in order to meet projected demand. And if new Chinese environmental regulations cause production and exports to decline this year, the global operating rate will need to tick up more than a couple notches.
Key Swing Factors
One of the key swing factors is agricultural commodity prices. It looks increasingly likely that the Southern Hemisphere will harvest another big crop this year, and if the Northern Hemisphere produces a big crop later this year, agricultural commodity prices could take a step down and jeopardize P&K demand, particularly during the last half of the year. First half shipment forecasts look safe.
Another is how quickly new capacity ramps up. As noted above, new P&K facilities are ramping up more slowly than advertised. However, mine development steadily progresses, bugs and bottlenecks get resolved, and operations stabilize at some point. This typically takes a long time at large greenfield P&K facilities, but shiny new plants eventually reach capacity.
Finally, new and more stringent Chinese environmental policies could become a game changer. These policies have resulted in sharp reductions in nitrogen production and exports this year. Similar reductions in phosphate production and exports are possible beginning this year.
Subscribe Today For
