Protein Mapping Identifies Nitrogen Limited Zones Within the Field
 October 26, 2020
 Water and nitrogen are the two major drivers of yield within cereal crops. Insufficient nitrogen availability and uptake by plants throughout the growing cycle will limit the yield of the crop. Accurately identifying the zones within a field where yield has been limited by the nitrogen availability, has been the objective of precision agriculture for more than 30 years.
Many technologies have been developed to measure the nitrogen content and distribution in soils across the field, as well as measuring the effect of water and nitrogen on the biomass production. These technologies have several limitations in that they do not reliably identify nitrogen limited zones. Now there is a new technology that measures the nitrogen in the seeds in the form of protein. An on-combine NIR analyser measures protein, moisture, oil, and starch in real time as grains are harvested. By combining protein and yield along with GPS coordinates, a new field map — Protein/Yield Correlation Quadrant Map — is generated that identifies zones where the protein is low, and the yield is low. These zones are where the application of more nitrogen fertilizer will produce a Positive Yield Response.
This article describes the three technologies that are available for farmers to measure nitrogen in the soil and discusses the application for each technology and the potential benefit offered to farmers.
Measuring Nitrogen
There are many scientific reports that demonstrate the relationship between nitrogen and yield in cereal crops, (i.e., wheat, barley, and corn). Nitrogen is required as the seeds sprout and emerge through the soil. If there is not enough nitrogen, then the plant may not develop the full number of tillers which then sets up the yield potential for the crop. During the stem elongation and leaf development stages, nitrogen is required in photosynthesis to produce the sugars and proteins that eventually make up the plant. Insufficient nitrogen during the biomass production stages will limit the size of the plant and the yield of the fruit that it will produce.

Lastly, during the flowering and seed development stages, nitrogen is transported from the stem and leaves and used in the development of the final seeds. Insufficient nitrogen may cause the plant to reduce the size and number of heads or cobbs and thus reduce the yield. If there is sufficient nitrogen and water throughout all stages of the plant’s development, then the plant should grow to achieve the Full Yield Potential. If there is excess nitrogen available, then it will result in more protein produced in the seeds.
Measuring nitrogen in the Soil, the stems, and leaves, and then in the seeds requires three different technologies.
1) Soil Testing: A direct measurement of nitrogen in soil is done by collecting soil samples across the field and submitting them to a laboratory where the samples are analysed using sophisticated analytical techniques, including Atomic Absorption Spectroscopy, Combustion Analysis, Inductively Couple Plasma Emission Spectroscopy, Ion Selective Electrodes, and titration. The direct method of measuring nitrogen provides high accuracy but is limited by the number of samples collected across each field and the relatively high cost of analysis.
Indirect measurements can be made using ground scanners such as EMC-38, Gamma Radiation, or Nuclear Irradiation. The field maps generated using these indirect methods are not specific to nitrogen but more to the ionic or salt concentration across the field. More recently, in-field sensors have been developed to measure nitrogen directly in field.
2) Stem and Leaf Testing: Direct methods of measuring stem and leaf tissue are available, however the process requires walking through the field with a hand-held sensor that measures the color of the leaf tissue. Alternatively leaves can be sampled and returned to a laboratory for more precise and specific analyses. However, the most common means of measuring nitrogen in the field during the biomass production stages is the NDVI (Neutral Density Vegetative Index), collected using satellite imagery or tractor mounted sensors. Since 70% of the nitrogen used by the plant occurs during the stem elongation and leaf development stages, measuring the nitrogen in the plant during the biomass production is important.
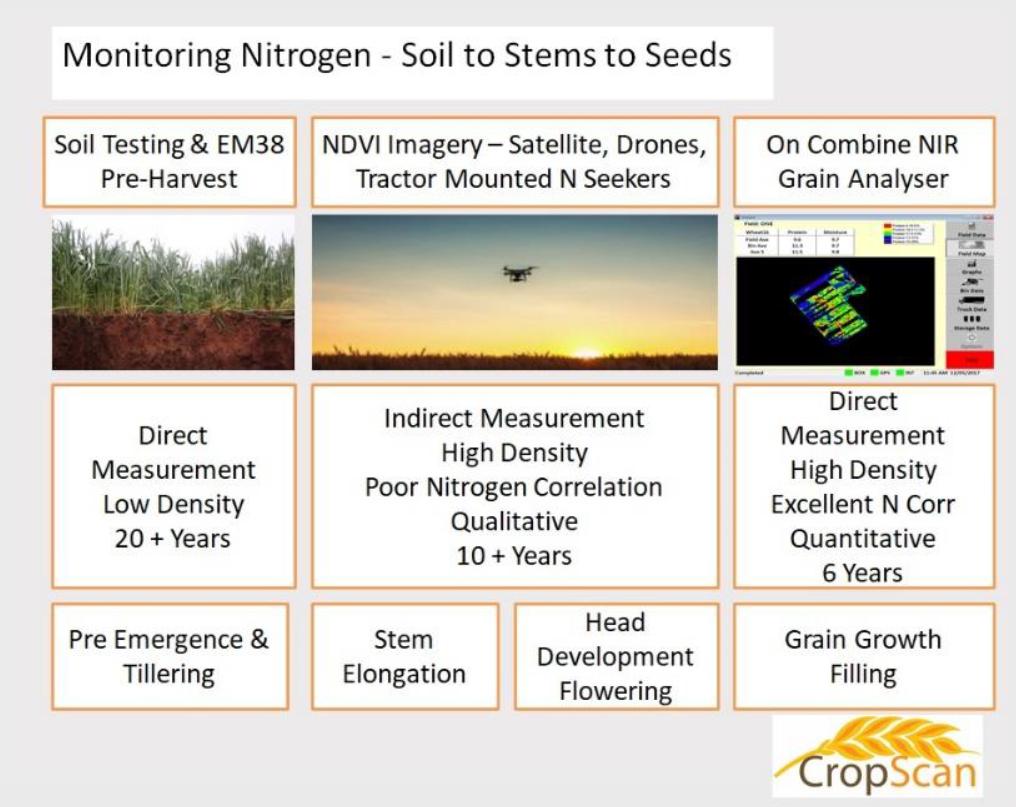
The difficulty of using NDVI as a measure of nitrogen is that other factors can also affect the NDVI measurement. Water stress, disease, frost, pH, and soil type can all result in the leaf tissue not becoming green or the biomass to be reduced. Also, NDVI measurements can be saturated. Once the biomass reaches a specific level, the NDVI does not increase. Nonetheless, NDVI can provide a means of gauging the relative health of the crop and allow farmers to top up the nitrogen when and where required.
3) Seed Testing: Near Infrared spectroscopy is used throughout the world to measure the protein, oil, moisture, and starch in grains and oil seeds. An on-combine NIR analyser (i.e. CropScan 3300H, Next Instruments) measures protein, oil, moisture, and starch in grains and oil seeds as they are harvested. Since proteins contain 16%-18% nitrogen by weight in the form of amino acids, measuring protein provides a direct measurement of the nitrogen in the seeds. By plotting the protein throughout the field, a direct measure of the nitrogen availability and uptake can be obtained at high special density and low cost.
Protein Mapping
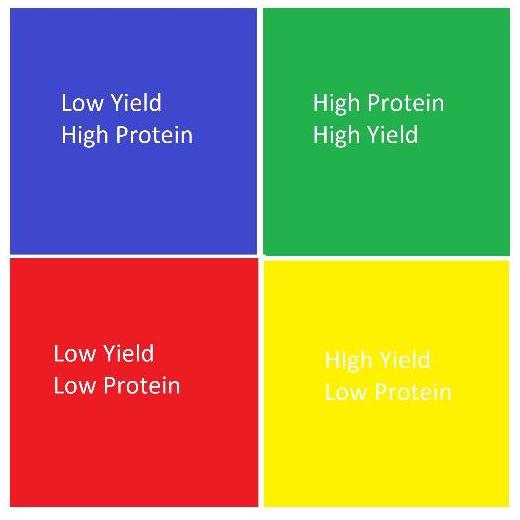 By combining protein and yield data collected off the combine harvester a more complete picture of the nitrogen availability and uptake by the plant can be developed. A new map called the Protein/Yield Correlation Quadrant map is generated by correlating the protein and yield across the field. By tagging the GPS coordinates with the protein and yield data, this map identifies four performance zones of where and how much nitrogen has been used by the crop at various stages of the growth cycle. The plot shows the four zones:
- Blue: Low Yield – High Protein
- Green: High Yield – High Protein
- Red: Low Yield – Low Protein
- Yellow: High Yield – Low Protein
The zones where the protein is low are where nitrogen has limited the growth of the plant and eventually the seeds. The zones where the protein is high are where there has been sufficient or surplus nitrogen to ensure the full yield potential has been achieved and the protein content optimized.
Research from Australia, UK, Canada, and U.S. shows that for wheat and barley crops, when the protein content of the grains is less than 11.5%, then the crop would have achieved a Positive Yield Response with the addition of more nitrogen fertilizer. By identifying the low protein zones within a field provides a simple and accurate means of generating Variable Rate nitrogen fertilization prescriptions.
Subscribe Today For
