Let’s Re-evaluate Zone Soil Sampling
 October 14, 2019
 A lot has changed since I wrote this article on sensor-based soil sampling 21/2 years ago.
First, I acknowledged that sensor-based soil testing is quite a ways off from being widely adopted. Taking physical soil samples are going to be the way to go for quite some time. With that being said, we can do a lot to update how we are taking these samples.
Next, let’s take an honest look at grid samples. When they first came out, they were a massive improvement from our old program of driving out to the field, taking some samples from the high spots, the low areas, and then maybe a sample or two from the area in between. When we got the results back we averaged those numbers and used that as the basis for our flat rate application.
Then when grid sampling came out, it was great because we could go out and see some variability across the field and treat those different areas according to the variability. Then we could also revisit those same points in the future to see how they changed. This made a huge difference for the vast majority of growers and was very profitable.
However, this system does have a few flaws. Mother Nature doesn’t work in straight lines, so it can be a challenge to set a grid that exactly captures the variability across the field.
My own farm in Northeast Iowa is a great example. It has pretty variable soils with quick sand, fossilized rock, and I guess a little bit of good dirt as well. When I had it grid sampled last time, I feel like we either missed certain key areas or we almost did just by how the grid was laid. Was this the sampler’s fault? Of course not. I’ve pulled roughly 90,000 soil samples in my day and it’s nearly impossible to know how to lay a grid down when you get to your 10th field for the day for the 50th day in a row.
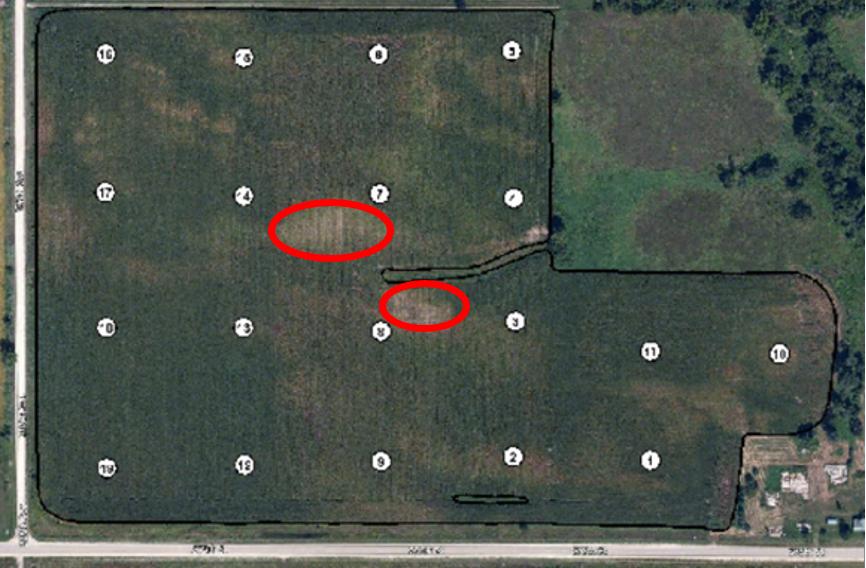
The grid sampling points miss key areas of variation in this field, most notably the areas of quick sand highlighted in red.
You might be thinking, “Yeah, they missed those spots, but what does it matter? They’re pretty small and that won’t amount to much difference.” Let’s take a look at the variable rate potash application that was made from those grid sampling results:
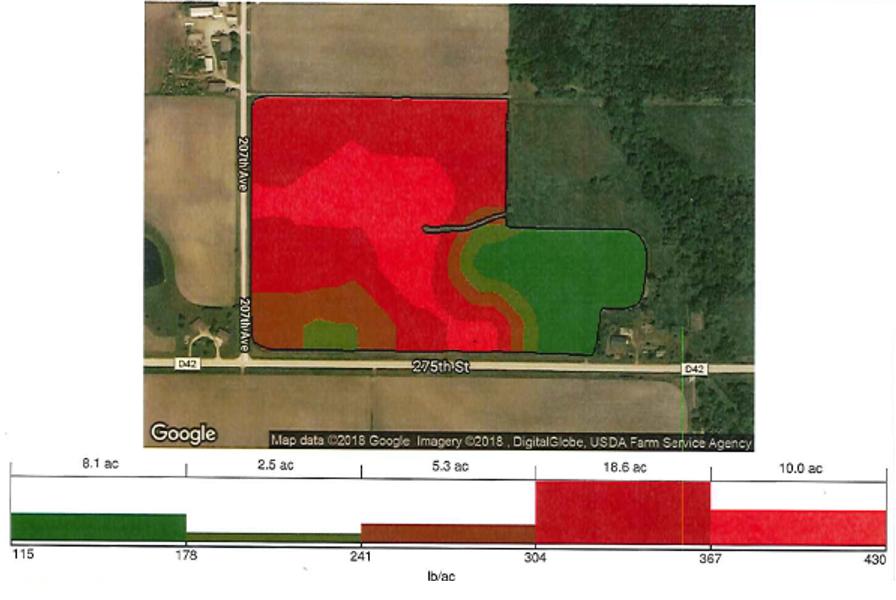
This map shows a variable rate application of potash at nearly 430 pounds per acre on quicksand with a corn yield potential of 90 bushels to the acre.
Hmmm…Seems a touch heavy on potash for an area with a top end corn yield of 90 bushels. Surely there has to be a better, more profitable way.
Many people have tried the zone method with SSURGO soil maps being the most popular approach. Those are pretty decent in a lot of areas for what they are. Remember, the purpose of SSURGO was to figure out how to appropriately charge taxes on a piece of ground. These were hand drawn between roughly the 1960’s to the 1980’s and were never intended for precision ag purposes. As a result, zone management using SSURGO can give you some really questionable results.
I know what you’re thinking, “What if there was a better way where we could use some more modern technology to create better zones?”
This isn’t a high in the sky theory, this is in fact exactly what we do here at Farmers Edge. We use satellite imagery at peak biomass to identify the higher and lower performing zones. And to take it a step further, we have a conversation with the grower and get his input on how he might adjust the map.
“Well it shows up as a bad spot on your map, but we just redid the tile down there and it should really be grouped with this higher producing area over here.” Boom, done!
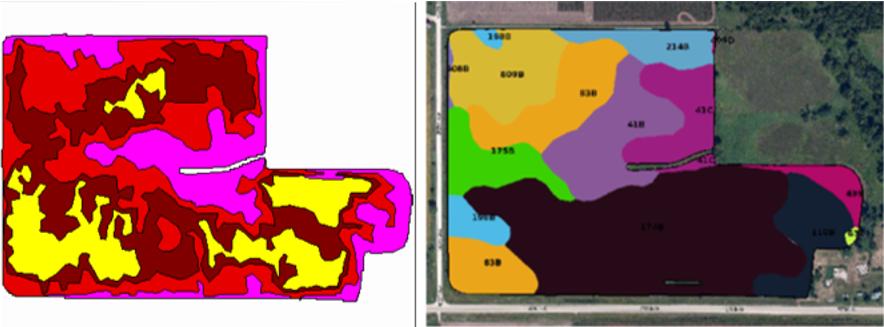
Farmers Edge zone mapping utilizing satellite imagery from peak biomass (left) compared to the SSURGO soil map drawn in 1982 (right).
So Farmers Edge is using the latest technology along with the grower’s experience and insight on a farm to give him a map he’s really comfortable taking to the field. When we utilize these maps to take soil samples, we are looking for variability and taking the samples versus the mentality of grid sampling where you are taking samples and looking for the variability in the results.
And this isn’t some theory of what we could be doing, we are actually doing this today and have been doing it for a number of years.
Maybe one day we’ll have a sensor-based approach that is accurate, affordable, and scaleable but that seems far off. Until then, I challenge you to give this more modern approach to zone management a really good look.
Subscribe Today For
