Progress In Agronomy: A Story Worth Telling
 February 1, 2017
 What’s the significance of 35 years? As we enter a new age of arguably increased uncertainty concerning many aspects of agriculture, agronomy, and fertility management, it seems appropriate to review the foundation of progress we stand on. It’s impressive, but one that provides us some critical challenges.
First, a reminder of life in 1982 — the IBM XT with no hard drive, two floppy drives, DOS 3.2, and a monochrome monitor was the exciting development in the PC world. Bill Gates had become a wealthy man with his contribution of computer language for the common person. The commercial cell phone became available.
Now, for the progress in agronomy — three-year average yields (1981-83) for corn, soybeans, wheat, and cotton were 101 bushels per acre (bu/A), 29 bu/A, 37 bu/A, and 547 pounds, respectively. Since then, corn yields have increased 70%, soybean yields 69%, wheat yields 28%, and cotton yields 48%. These are truly remarkable gains that resulted from improvements in genetics, technology, and grower management. Digging a bit deeper into the 35-year corn story shows the following:
- Addition of 70 bu/A to average corn yield (70%)
- Addition of about 6 pounds of nitrogen (N) per acre to average rate applied (5%)
- Increase in partial factor productivity for N of 0.4 bushels per pound of N (50% increase)
- Corn growers such as David Hula and Randy Dowdy demonstrating that yields of 500 bu/A are possible with existing technology and that exploitable yield gaps remain, even in North America.
The Rest of the Story
Such progress with crop productivity and N efficiency is impressive in itself, but there is more to the story when one evaluates simultaneous cropping system changes in the U.S.
- Percent of cropland under conservation tillage went from 18% in 1982 to 42% in 2008.
- Soil erosion was reduced by over 40%, decreasing from 3.05 billion tons in 1982 to 1.72 billion in 2010.
- Soil erosion above “T” on highly erodible land (HEL) went from 1,300 million tons in 1982 to 600 million tons in 2007, still too high but a 50% plus reduction.
- The combination of higher yields and reduced tillage in some states, especially in the western Corn Belt, seems to have reversed the decline in soil organic carbon (SOC) that started with the cultivation of our native soils. For example, the average SOC in producer samples (0 to 6 inches) submitted to the South Dakota State University soil testing laboratory increased 25% from 1985 to 2010, about 1% per year. Data from private soil testing laboratories on samples from South Dakota and some neighboring states show similar trends. Considering that increasing SOC in such cases had to cause net N immobilization, the increase in apparent N use efficiency mentioned earlier becomes more impressive. However, we would benefit from renewed commitment to long-term system studies and continuous sampling/measurements (with good baseline archived samples) to better equip agriculture to monitor and report on measured N balance and soil health across the country.
But have we progressed with nutrient stewardship in general? Let’s again look at relevant metrics.
Soil testing remains the most important science-based metric of the fertility of our soils and the nutrient supplying component of soil health. Use of this tool in the U.S. has grown from less than 3 million samples per year in 1982 to 10 million samples in 2015. Much of this growth has occurred in the last 10 years with precision agriculture being a major driver in the increase. Nutrient use has never been as measurement-guided as it is today.
Limited data exist on the aggregate status of soil phosphorus (P) and potassium (K) levels for the U.S. in 1982. Some individual states have summary data that goes that far back but the detailed summaries led by the International Plant Nutrition Institute did not begin until 2001, with repeated summaries in 2005, 2010, and 2015. What do these show?
For soil test P, the number of samples testing far above agronomic critical ranges are decreasing — a good thing as it suggests more economic P use and potentially positive impacts on water quality. However, the samples clearly testing below agronomic critical levels are increasing, which may point to fields or areas in fields where yield is being hurt from insufficient P use. The remaining challenge is to increase the number of samples testing in the optimum range for the cropping system — bring the low ones up and continue to bring the very high ones down.
For soil test K, the trends are similar. The decrease in very high testing soils is mostly related to the continued depletion of soil K in Western states with very high indigenous soil K levels. These are slowly declining and causing expansion in the size of regions where K fertilization is needed to meet crop needs.
The following table summarizes nutrient balance changes from 1987 to 2012 using IPNI’s NuGIS model.
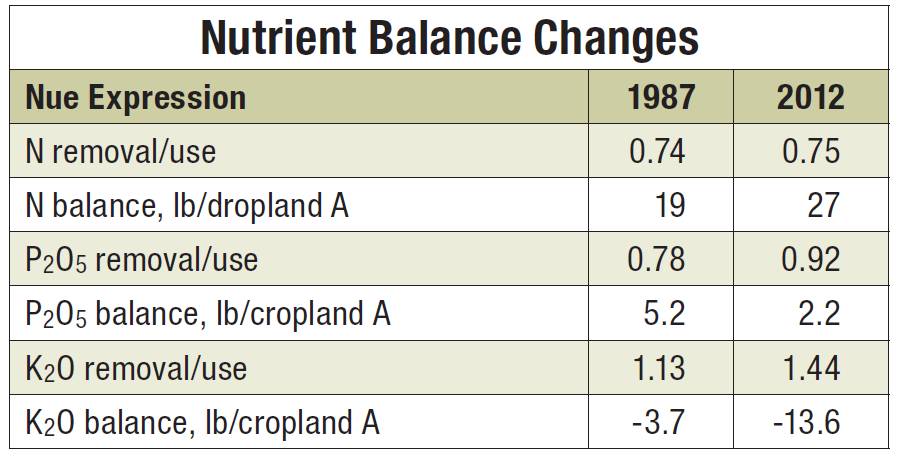
For N, the summary shows that even though crop yields and associated nutrient needs have markedly increased, producers have been able to meet them without reducing the removal to use ratio and with a relatively minor increase in net balance, even though less N is being mined today from soil organic matter than in the past, and in some cases as discussed earlier, is being restored.
As a nation, P use has become remarkably efficient with removal to use ratios exceeding 0.9 and very low net balance. However, major differences among regions and cropping systems exit.
K balance at a national scale is skewed in a negative direction due mostly to the very high testing soils of the West and increases in K removal as crop yields continue to increase.
The 1992 launch of the Certified Crop Adviser program by the American Society of Agronomy at the request of and under the leadership of the agriculture industry marked a huge leap forward in nutrient stewardship and agronomic practice. This unique force in the world of agronomy has been instrumental in the progress outlined in this article and promises to be even more so in the future.
The Importance of the 4Rs
I personally believe that the greatest sign of progress in nutrient stewardship during this 35-year period was the advent of 4R Nutrient Stewardship. Considering that this concept in its current structure is only 10 years old, its impact on the mind set of producers, advisers, NGOs, and researchers on what determines “right” is truly remarkable as it brings to the table the economic, environmental and social impacts of each management decision. Impressive as well is the fertilizer industry’s financial support of research on impact metrics through the 4R Research Fund launched during one of our infamous “down-turns” in industry profitability.
We have made great progress in agronomy in the last 35 years. In spite of that progress, issues and challenges remain. We will continue our efforts to increase productivity and profitability for producers. We will continue our efforts to reduce nutrient loss to surface and ground water. We will continue our efforts to reduce loss of nitrous oxide, ammonia, and other N forms to air. We will continue our efforts to capture more nutrients in the crop rather than exposing them to detrimental fates in the environment.
But perhaps our biggest challenge is to tell our story — to help the public appreciate the remarkable progress of the last 35 years and our dedication to accelerating that progress in the future. Its progress is based on advances founded in science-based technologies and hard facts. In this age where the relevance of both seem to be questioned by a public whose beliefs are formed more by social media than by the scientific method, we do indeed have a challenge. It’s a challenge we can better meet through credible education than by questioning individual motives.
As an example, in a recent letter to the Director General of FAO, Pope Francis criticized modern agriculture for its “production at any cost”, “improperly modifying various animal and plant species,” and for using a model that “despite all its science, allows around 800 million people to continue to go hungry.” One cannot question the motives of such a man, but we can use these statements to inspire us to better communicate our own motives and dedication to future progress. We have a story worth telling.
Subscribe Today For
