Global Nitrogen Market: 6 Factors to Watch in 2019
 February 25, 2019
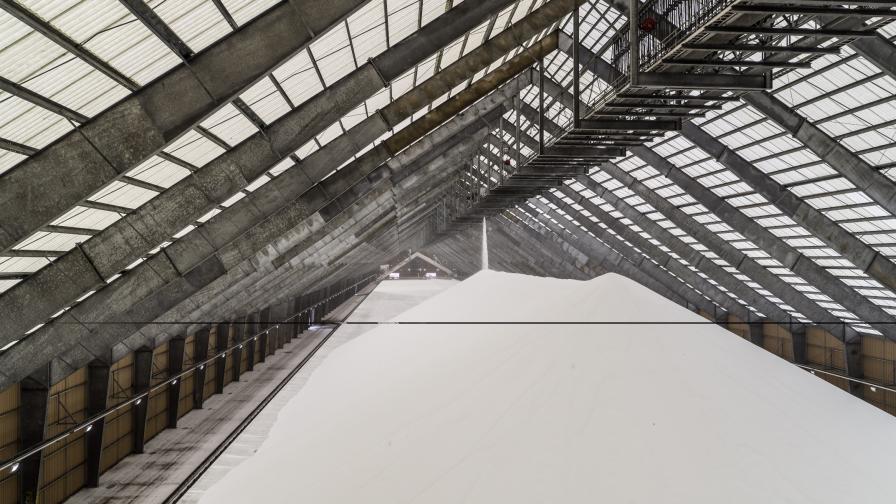
Nitrogen remains a dynamic market whose prices are driven up or down by a number of factors. Photo: CF Industries Port Neal (IA) Nitrogen Complex.
Two years ago on this site I wrote that “demand will absorb excess supply, and the global supply and demand balance for nitrogen should start to resolve beginning in 2018,” and that “we expect prices to begin to rise in 2018.”
This was not a prediction made lightly. For several years the global nitrogen market has been in a state of transformation due to major nitrogen capacity additions through 2016, including in North America. During this time, urea prices reached lows not seen in nearly 20 years, and pricing for all products was volatile. As a result, producers, traders, wholesalers, and retailers had to adapt to new global trade flows — with urea imports into the U.S. during 2018 being 47% below the five-year average — and pricing patterns contrary to historical norms.
But global nitrogen fundamentals always eventually play out. Demand for nitrogen has continued to grow, driven by increased industrial uses and higher agricultural demand in places like South America and Asia. New capacity additions have slowed. And as we saw in the second half of 2018, global nitrogen prices did begin to rise and largely maintain those higher levels.
Nitrogen remains a dynamic market whose prices are driven up or down by a number of factors. As you look ahead to 2019, these are the six you should watch most closely:
1. Energy Prices in Europe, Asia
Energy — whether natural gas or coal — is the largest input cost in nitrogen manufacturing. A significant driver of higher global nitrogen prices in 2018 was the increase in the cost of natural gas in Europe and liquefied natural gas (LNG) in Asia. Near the peak of global urea prices in 2018, the price of natural gas per MMBtu at the Dutch TTF natural gas hub was 63% higher in September 2018 compared to September 2017. The Asian LNG spot price was 66% higher in September 2018 than the same time the year before. As a result, nitrogen facilities in Asia that rely on imported natural gas (Bangladesh, India, and Pakistan) and in Europe (Croatia, Estonia, Hungary, Lithuania, Netherlands, Romania, and Ukraine) required higher prices to operate, and some curtailed production.
Energy prices in these regions moderated near the end of 2018, and global urea prices fell from 2018 highs. However, we expect producers in these regions to continue to face high natural gas and LNG costs into the first half of 2019 as a result of the winter heating season in the Northern Hemisphere and continued LNG demand growth. These higher feedstock costs should continue to challenge marginal producers’ ability to operate profitably, pressuring nitrogen production in these regions and continuing to support nitrogen prices.
2. Slowing Net New Urea Capacity Growth
There were more closures of global urea capacity in 2018 than new capacity added — the first time in recent memory that this has occurred. The 4.3 million metric tons of nameplate urea capacity that came online during the year was more than offset by permanent closures of urea capacity in China and Kuwait.
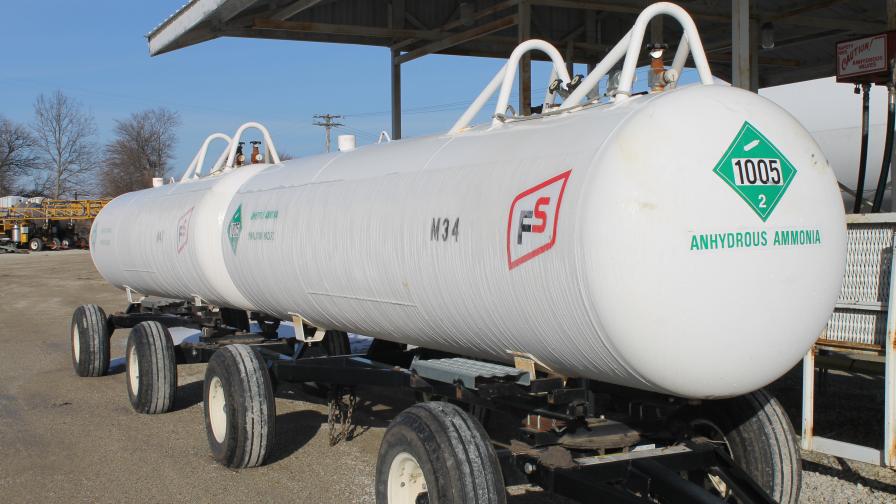
Two nurse tanks of ammonia await transport.
While we don’t expect another year in the near future in which net urea capacity growth is negative, we do expect the global nitrogen supply and demand balance to tighten through 2021 at least. Over these next several years, demand growth should outpace net global capacity additions. Because it takes roughly four years to construct an ammonia-urea complex, it is unlikely that additional plants will come online during this time period, beyond what is already visibly under construction. Additionally, we expect the closure of two urea plants in Brazil in 2019 and new capacity coming online in Iran in 2019 to have a limited impact on the global market because of the next factor discussed below.
3. The Effect of U.S. Sanctions on Iran
We’re monitoring closely the impact of sanctions on Iran. In the short term, outlets for the estimated annual 3 million to 4 million metric tons of Iranian urea exports appear to be more limited than in recent years. Most significantly, India did not purchase any product from Iranian sources in its urea tender in October. Iranian producers will face additional challenges should the sanctions continue due to the loss of access to technical expertise, replacement parts for current plants, and resources to support new construction.
4. China’s Shrinking Role in the Global Nitrogen Market
China’s role in globally traded urea continued to shrink in the third quarter because of the enforcement of environmental regulations, limited export volumes, and high feedstock costs, with anthracite coal costs up 22% year over year. From January through August 2018, China exported less than 1 million metric tons of urea, a 72% decrease from the same period in 2017. Additionally, China increased ammonia imports from 700,000 metric tons in 2017 to 1.2 million metric tons in 2018, supporting global nitrogen prices. Firm coal prices, high environmental compliance restrictions and costs, natural gas use restrictions, and the winter heating season are expected to continue to limit supply available for export into the first half of 2019. It is expected that China will continue to move toward a self-sustaining urea production level and supply spot export tonnage from those plants that were built for export.
5. Demand in India, Brazil
While North America still requires imports to meet its nitrogen needs, it is no longer the largest nitrogen-importing region in the world. Today, India and South America (led by Brazil) import more urea than North America. It is a situation that is unlikely to change in the foreseeable future.
India’s tender process, where government entities request bids for large quantities of urea a limited number of times per year, will ensure that India’s role in global urea prices remains outsized. When India is purchasing, global prices tend to be higher. When the country is not, suppliers to India have to find different outlets for their product, which typically causes prices to drop.
Brazil, in contrast, will import nitrogen throughout the year, though, much like North America, it will import more to meet demand in its fertilizer application season. Additionally, the country is expected to increase imports of urea by 600,000 to 700,000 metric tons in 2019 compared to 2018 due to the closure of the two urea plants mentioned earlier.
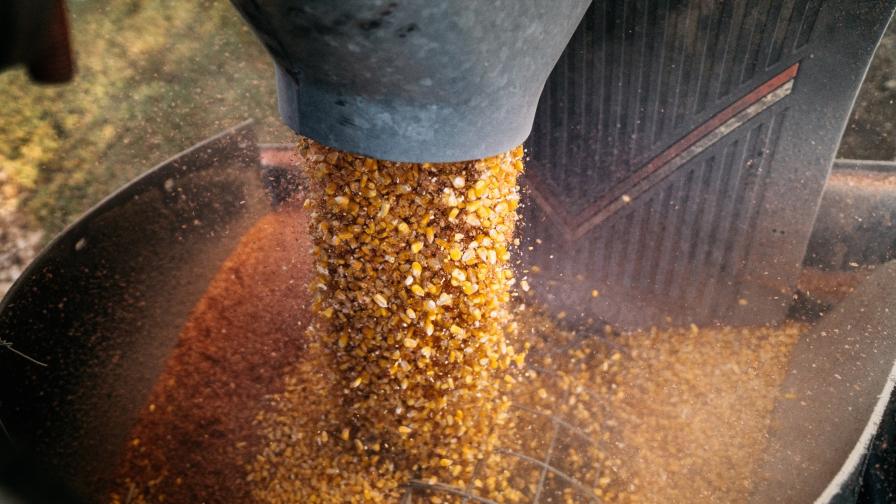
CF Industries projects that U.S. growers will plant 93 million acres of corn in 2019, approximately 4 million more acres than in 2018.
6. Timing of Demand in North America
We project that growers in the U.S. will plant 93 million acres of corn in 2019, approximately 4 million more acres than in 2018. This, along with expected increases in wheat plantings, will drive stronger nitrogen demand in North America.
As we’ve discussed the coming spring application season with industry participants, it is clear that they are less worried about supply as they are logistics. In 2018 a cold and wet spring delayed planting, and thus fertilizer applications, well into May. The technology that growers use today enables them to catch up on plantings if there’s a late start to the season. But that ability means more growers need fertilizer in the same small window. In 2018 this put tremendous stress on the fertilizer supply chain. We have seen an increase in forward-buying, which should ensure more product is positioned properly in advance of the spring fertilizer season. However, the supply chain still could face challenges this spring depending on the weather.
Taking these factors together, it suggests that we are in a period of generally rising global urea prices. However, prices are unlikely to rise unabated during any one year as the factors I detailed, and others, will drive shorter-term increases and decreases.
Subscribe Today For
