Do you have a Sulphur Deficiency and not know it?
 Research indicates that deficiencies in sulphur, a plant nutrient required by all plant biological systems, not only reduces yields, but adversely affects quality. Plants struggling with insufficient sulphur present a slow growth rate and poor response to nitrogen. Plant sulphur nutrition and its role within the plant’s biological and chemical processes have contributed to increased awareness of sulphur deficiencies in crop production.
Plant sulphur nutrition has become a greater issue as soil sulphur levels have decreased due to emission-reducing technologies and other factors. Unfortunately, determining the supply of sulphur to a crop is more complicated than for most other nutrients, making it difficult to pinpoint when plants are suffering from sulphur deficiencies. One complication is there are both natural and “man-made” sulphur sources that perpetually fluctuate in their reactivity. The good news — is that persistent research efforts have provided a large data base employing soil sample analyses, plant tissue analyses, and “in-field” diagnostic crop deficiency symptoms to establish criteria for the assessment of sulphur status in crops.
Chemical soil test analyses can be an important tool in monitoring soil sulphur. The interpretation of sulphur soil test results requires significant field information to provide a sulfur recommendation. Reliability of these tests varies due to several factors including sources of sulphur, soil properties, leaching, and chemical/absorption equilibrium.
Therefore, use of a soil sample analysis is not recommended as the only tool to determine the best sulphur strategy for maximum crop yields.
The Hidden Hunger
While observation of the crop’s symptoms can be useful in diagnosing nutritional issues or other factors that influence crop yields, it will not detect “hidden hunger”.
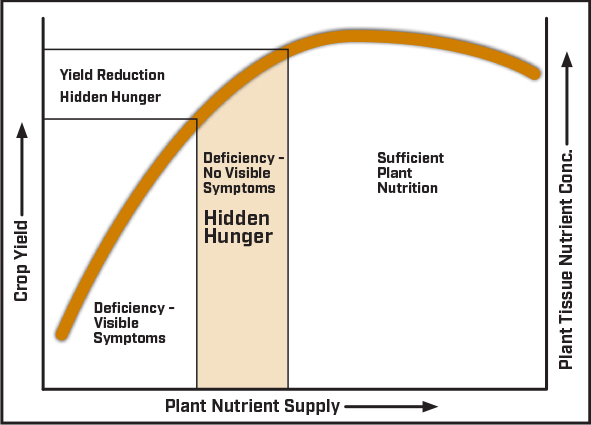
Deficiency symptoms result from an imbalance of compounds within the plant when one or more nutrients are lacking. Plants display nutrient deficiency symptoms when the nutrient supply drops below a threshold that the plant’s physiological, biological, and chemical processes cannot function normally. If plants have digressed to this point, generally yield potential has already been reduced.

Figure 1: Plant Nutrition Response Curve
More important is the ability to detect “hidden hunger”. Hidden hunger is when plant nutrient concentration drops below optimum levels but is above the threshold that triggers physiological deficiency symptoms. Therefore, a crop that is not showing symptoms of nutrient deficiency may still not have a sufficient supply of nutrients to maximize yield potential (Figure 1). The cost of balanced soil fertility is minimal compared to risk of hidden hunger reducing yield potential. A yield plateau may indicate that crop growth has been limited at some point during growing season due to inadequate nutrient supply in the absence of physiological nutrient deficiency symptoms. Plant tissue analysis is an excellent tool to identify hidden hunger.
Plant tissue analysis and plant tissue testing should not be confused. Tissue testing refers to a field test were plant sap is collected from fresh plant tissue and chemically analyzed on site. Plant tissue analysis is performed on dried plant tissue in a laboratory. Plant tissue analysis is a laboratory determination of the total elemental content of plants or plant parts. It can be utilized to monitor crop nutrient status, diagnose problem areas, and serve as a basis for perennial fruit crop recommendations.
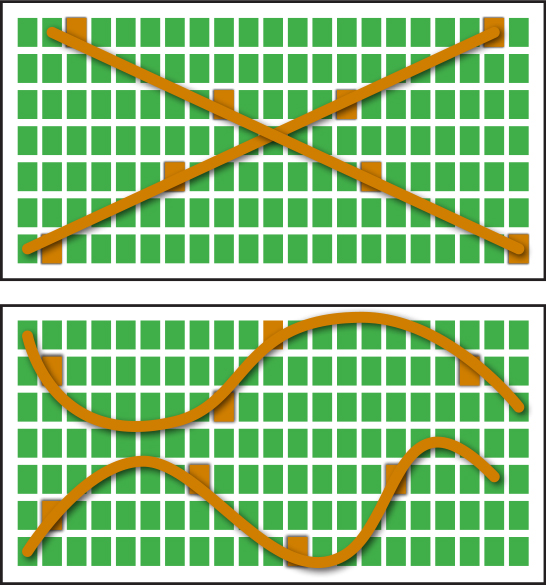
The plant nutrient content represents the effects of nutrient uptake by plant, soil nutrient status, environmental conditions, and all other factors that influence plant growth. Proficient plant tissue sample collection is critical in order to collect meaningful data that will lead to improved crop nutrition and increased yield. The determination of plant health situation will be influenced by the growth stage when tissue samples are collected, and plant parts collected. Plant tissue samples must be collected to accurately represent the area in question. Two appropriate sampling patterns are the traverse and zigzag as shown in Figure 2.

Figure 2: Patterns for collecting plant tissue samples.
It is important to minimize the potential for contamination at collection from soil and/or rust on sampling equipment for valid data. Avoid sample collection during heat stress and immediately following pesticide application. A given nutrient concentration for optimum plant growth will vary from one area of a plant to another. Plant tissue samples need to be collected from the same plant part and growth stage that has been used in the development of interpretative data. Some crops and their corresponding tissue sample parts are provided in Table 1.
Table 1: Plant Tissue Sampling Guidelines
| Crop | Sampling Time | Plant Part |
| Corn | Beginning silk | Ear leaf |
| Soybeans | Initial flowering | Upper most mature trifoliate leaf |
| Cotton | First bloom | Youngest fully mature leaves on main stem |
| Tomatoes | Early bloom stage | Third or fourth leaf from growth point |
| Apples | Mid-season | Leaf from mid-point of current year’s growth |
Soil tests have been the standard to formulate crop nutrient recommendations for row crops and forages. Fruit tree scientists prefer to employ plant tissue analysis as the primary foundation for plant nutrient recommendations. Perennial fruit tree crops have deeper rooting systems and utilize nutrients from greater depth in soil profile compared to annual row crops.
Fall Application
Soil sample analyses and plant tissue analyses are both excellent nutrient management tools. Plant sulphur deficiencies result in poor response to nitrogen, reduced yields and adversely affect quality; therefore, long-term nutrient management benefits are realized when these tools are employed to monitor sulphur nutrient status. Sulphur is impacted by several external factors and can create management challenges. A single year’s data may not provide definitive answers, but as results from multiple crops are compiled over time, trends become more evident and the information gains greater value. When sulphur deficiencies are detected, one of the best products on the market to improve this issue is Tiger 90CR Sulphur.
Tiger 90CR Sulphur is elemental sulphur that depends on soil microbial activity to convert (oxidize) it to plant available sulfate (SO4-2). Time is required for the oxidation process which may be two weeks to greater than two months or longer. Tiger 90CR Sulphur, can be blended with other dry fertilizer products and applied in fall. Environmental conditions such as freeze-thaw and wet-dry cycles will enhance Tiger 90CR Sulphur breakdown and plant availability. Surface incorporation will increase the speed of sulphur oxidation process by moving the sulphur pastilles into soil where greater contact with soil bacteria can occur. When soil temperature begins to rise in spring soil bacteria, especially Thiobacillus become active and contact the small sulphur particles resulting in faster oxidization of sulphur to sulfate.
Begin your long-term sulphur nutrient management planning today and include Tiger 90CR Sulphur in your fall fertilizer mix. For further information on plant tissue analysis with corresponding interpretative data tables, fall application of Tiger-Sul Products, and application rates for specific crops contact your Tiger-Sul representative at https://www.tigersul.com/find-a-rep/.
References:
Johnston, A.M., Making the Most of Plant Tissue Analysis, Potash & Phosphate Institute, 2001.
Plant Tissue Analysis; Part 1, Section2: Soil Fertility Management, Penn State University Extension.
Reetz, Harold, Hidden Hunger…Even the Best Suffer, Potash & Phosphate Institute.
Soil Fertility Guide PL-1, University of Maryland Extension, 2010.
Tabatabai, M.A. (ed.), Sulfur in Agriculture, American Society of Agronomy, 1986. Walsh, L.M. and J.D. Beaton, Soil Testing and Plant Analysis, 1986.