No More Playing the Yield Guessing Game: FieldAgent® Tassel Count Analytics
Row by row, ear by ear. For generations, this was the most reliable way to capture tassel counts and estimate potential yields. Agronomists and growers did this by selecting a few spots per field, going to each of those spots, conducting kernel counts and running those counts through a yield calculator on a notepad. The low sample size and enormous time investment required for this process created multiple inefficiencies and left more than enough room for error.
But, those days of walking the field under the hot summer sun to gain an incomplete picture into what will appear on the yield monitor are gone.

How it Works
FieldAgent Tassel Count counts the plants that have developed a tassel and have the potential of producing full ears. This is done by a user — a grower, agronomist or retailer — flying a Sentera-equipped drone over their field.
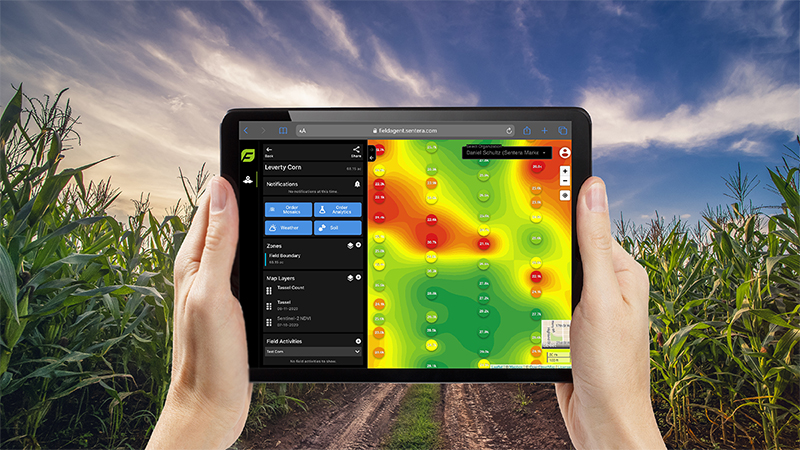
From this flyover, the user generates an accurate zone map through FieldAgent that shows the average number of standing plants depicted with a red, yellow or green indicator. Then, it directs the user to specific locations to collect ear samples, streamlining the time spent in the field.
Unlike the traditional way of taking ear and kernel counts at a handful of sporadic locations throughout a field, the Sentera tassel zone maps are improving this estimate by directing growers, agronomists and retailers to take counts at targeted locations representative of the variation present in each field. For example, a user may take three samples in a “good” zone, three samples in a “medium” zone and three samples in a “bad” zone to get the most comprehensive estimate of potential yields.
Mapping Out Success
Tassel count zone maps are another layer a grower, retailer, or agronomist can utilize when evaluating crop performance across a field; especially when weighing in-season management decisions and long-term planning. The data derived from these maps can be leveraged alongside as-planted data, FieldAgent stand count layers, nitrogen application data, soil type and Sentera NDVI-based crop health maps.
Once a field is harvested and the yield data is added to all the different layers of data, a grower can truly understand how an area in their field performed. Specifically, how many plants emerged based on seeding rate, how those plants matured and absorbed available nutrients and, ultimately, how many bushels those plants produced.
Having this comprehensive and accurate view of tassel count can help growers, retailers, and agronomists make more informed agronomic and economic decisions.
Learn more about how FieldAgent Tassel Count can work for you to simplify the in-season yield guessing game and decision-making.