Making Your Variable Rate Technology Pay
 July 8, 2020
 Precision agriculture or precision farming has an end game that often revolves around Variable Rate Applications (VRA). Collecting field maps, performing soil tests, and conducting strip trials, are all about managing nutrient applications to increase yield (quantity), increase protein (quality), and reduce fertilizer usage and costs.


View all

Spreading, seeding, and spraying equipment are the hardware elements of Variable Rate Fertilization (VRF) technology that involves the most cost to farmers. An investment of between $150,000 and $250,000 for this equipment is not uncommon. As such farmers need to therefore be able to recover this cost and to make a profit out of the investment.
This article looks at the cost of VRF technology and provides a novel accessory that can increase the Return on Investment (ROI).

What is Variable Rate Technology?
In precision agriculture, VRA “refers to the application of a material, such that the rate of application is based on the precise location, or qualities of the area that the material is being applied to.”1 This is different from “uniform application and can be used to save money (using less product) and lessen the environmental impact.”2
VRA can be developed based on field maps or real-time sensors. There are three types of VRA technologies commonly used in grain farming:
- Variable Rate Seeding
- Variable Rate Weeding
- Variable Rate Fertilization
Variable Rate Fertilization is where one or several nutrients are applied across a field at a rate that is designed to affect a certain outcome. Increasing the yield is the most attractive outcome as farm income increases directly with output. Reduction in input costs is an attractive outcome but the dollars saved in reduced fertilizer can be far less than the gain achieved through increasing yield. Lastly, improving quality parameters such as protein or oil can increase income but to a lesser extent than yield increases.
The most common pieces of equipment used for VRF applications is an air seeder. Spreaders can also be used, however they do not have the flow control to make true VRF applications. A spreader may be suitable where broad variable rates can be applied in larger zones. For true VRF application, an air seeder with a suitable flow controller and console are required. Air seeders can carry several carts and be used to apply granular and liquid fertilizer plus other chemicals. Depending on the complexity of the system, a price tag of between $250,000 and $750,000 is warranted.
Variable Rate Application Maps
To establish the VRF application, there needs to be a sensor layer which describes how the soil and the nutrients vary across the field. VRF maps can be based on yield, satellite imagery, and NDVI, EMC38 Soil Scans with subsequent soil testing, elevation, and soil moisture layers. More recently, VRF maps have been developed using protein measurements collected off the combine as grains are harvested.
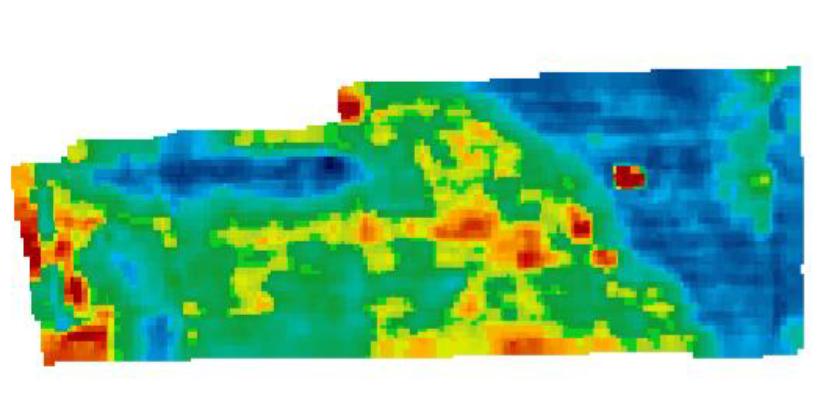
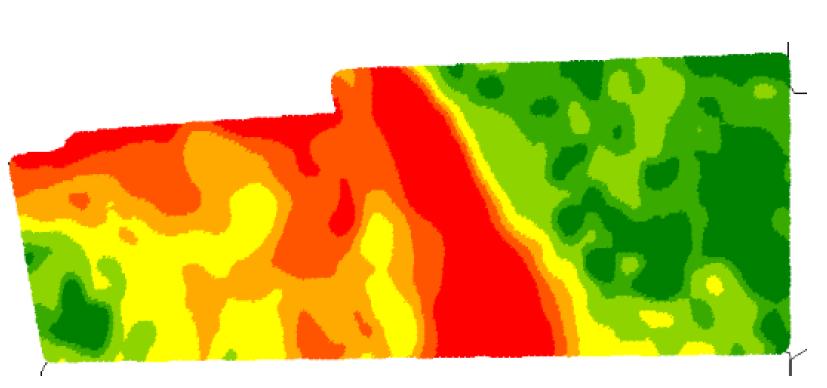
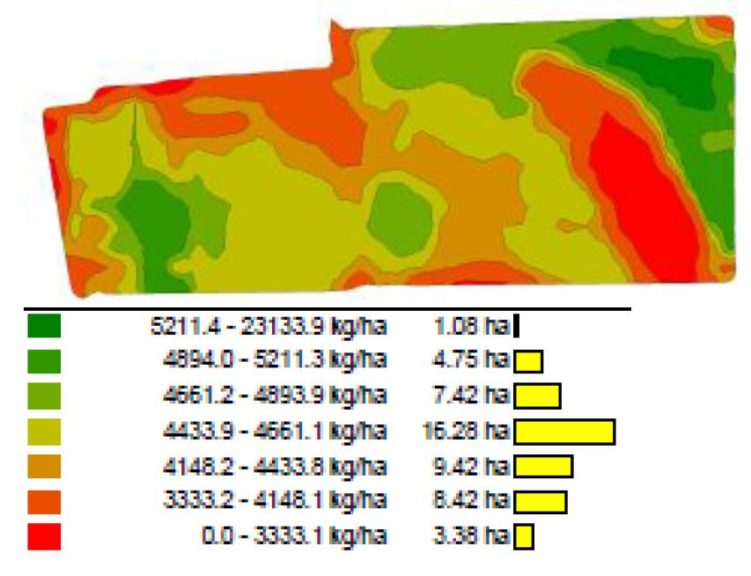
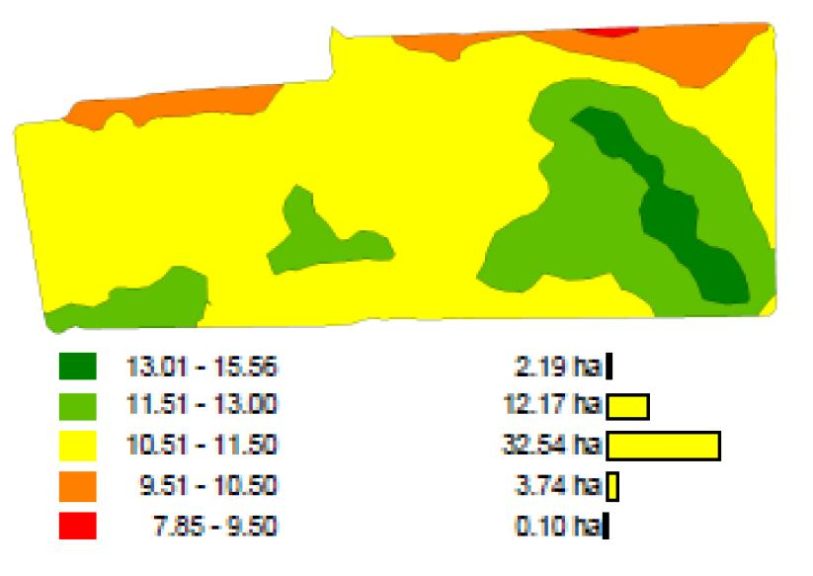
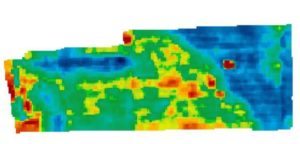
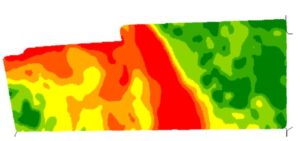
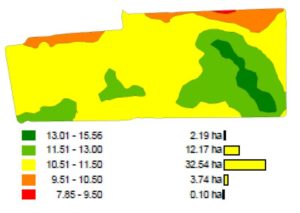
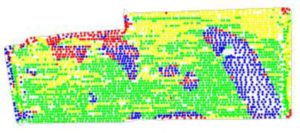
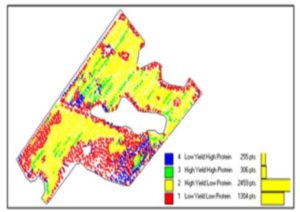
By combining the protein, yield, and GPS data from the combine, a new diagnostic tool (i.e., a Protein/Yield Correlation Quadrant Map) can be generated across the field. Figures 1, 2, 3, and 4 show examples of field maps for a field in South Australia based on NDVI from a satellite, EM38, Yield, and Protein. Figure 5 shows the Protein/Yield Correlation Quadrant map collected off a John Deere 780 combine in 2016. (Note: All Figures are also shown in the slideshow above.)
Protein/Nitrogen/Yield Balance Curves
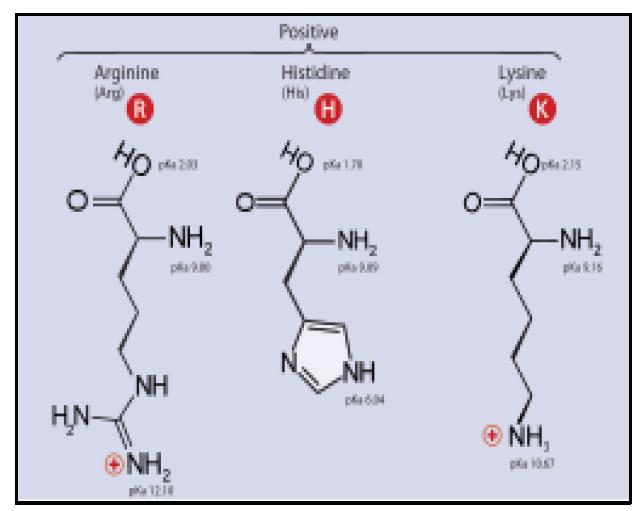
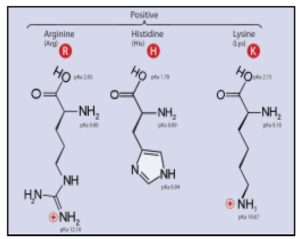
Protein are made up of long chains of peptides, which are made up of amino acids which contain nitrogen (Figure 6). Approximately 17% of the protein in grains is nitrogen by weight. For every tonne of grain harvested in the field, between 16 and 32 kg of nitrogen is removed from the soil. Measuring protein in grains provides a direct means of measuring nitrogen availability and uptake from the soil in the field, however the relationship between protein and yield is not so obvious.
In 2013, Greg McDonald and Peter Hooper, University of Adelaide, School of Agriculture, wrote an article for the GRDC titled “Nitrogen Decisions – Guidelines and rules of thumb.” They referenced a paper written in 1963 by JS Russell for the Australian Journal of Experimental Agriculture and Animal Husbandry where he described the idea of using grain protein concentration to assess the likelihood of N responsiveness in wheat cropping systems. He suggested that yield responses were most likely when grain protein concentration was < 11.4%.
McDonald and Hooper also said: “Based on recent trial data, the general conclusion still appears valid: 100% of all trials where grain protein concentration of the unfertilized control was <8.5% were responsive to N and would have given yield response of 14kg/kg N. When grain protein concentration was >11.5%, only 32% of the trials were responsive to N and the mean yield response was zero.”
They concluded: “ While this relationship can’t be used to make in-season N decisions it may be useful in helping to assess the degree of N stress during the previous season and making postharvest assessments of N management strategies, which can help in future plantings.”
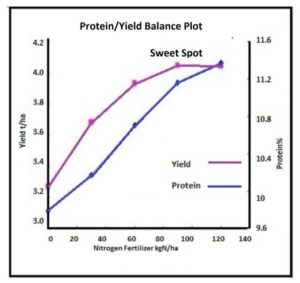
Brill et al, showed that the Yield and Protein increases with the application of additional nitrogen fertilizer of 30, 60, 90 kg/ha. However, above 90kg/ha, the yield flattened out and only the protein continued to increase. Figure 7 shows the plot of yield, protein, and nitrogen fertilizer rate. The explanation is perfectly consistent with the understanding of how plants take up and use nitrogen throughout the growth phases. Once the plant has reached its full yield potential (i.e., a complete set of heads filled with grain), then any excess nitrogen is stored inside the seeds in the form of protein. If the crop has not had sufficient water, nitrogen, or other nutrients, then it will not have reached it full yield potential. Late application of nitrogen fertilizer as a result of collecting NDVI data, can drive the yield, however if the plants have been forced to abort tillers or reduce the number of seeds per head, then the yield cannot be recaptured by applying more nitrogen.
Implications of the Protein/Nitrogen/Yield Balance for VRA
Simply stated, if the protein content of the harvested grain is less than 11.5%, then the crop did not achieve its full yield potential. The Protein/Yield Correlation Quadrant map provides a means of identifying the zones in the field where the protein and/or yield are low or less than the average. By applying more nitrogen into these zones, a positive yield response will be achieved.
A farmer in Esperance, WA, conducted a series of strip trials on a wheat field in 2017. He applied Flexi N UAN fertilizer at rates of 1, 50, 10, 150 and 200 litres/hectare. He then measured the yield and protein in his New Holland CR9.90 combines, which had the CropScan 3000H On Combine Analyser fitted in 2016. Figure 8 shows the Protein/Yield Correlation Map for this field.
Table 1 provides the protein and yield results at each Flexi N application rate. The table and plot show that the yield increased by 0.6T/100L and the protein increased by 0.9%/100L of Flexi N.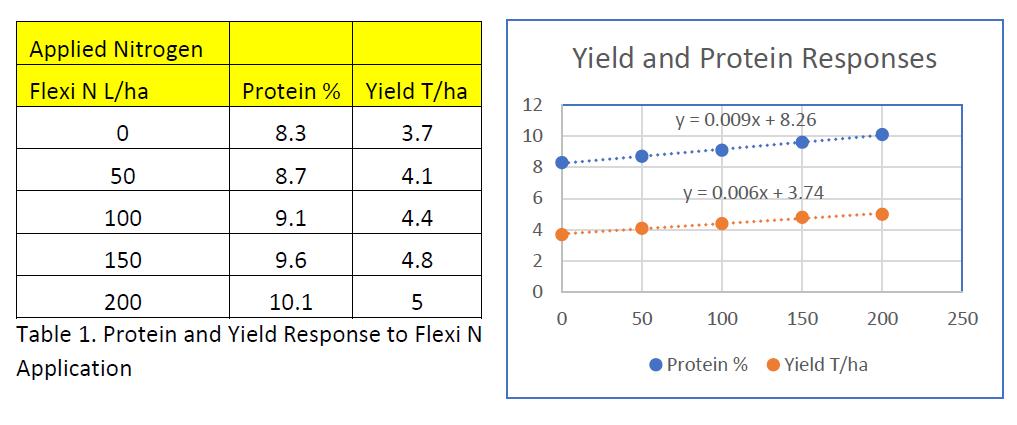 The implication for VRF applications for nitrogen fertilizer are that the farmer can now use the Protein/Yield Correlation Quadrant map to identify the zones (i.e., yellow and red zones), and then calculate how much additional nitrogen fertilizer is required to increase the yield in these zones.
Return on Investment for VRA Technology
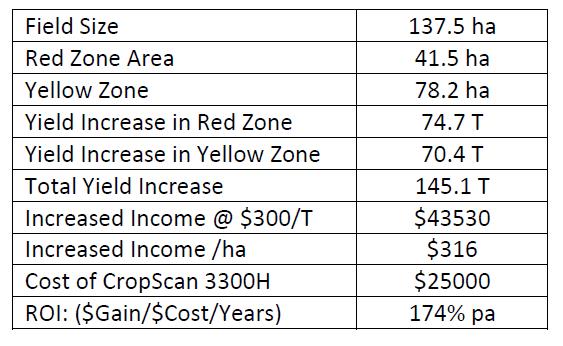
Table 2
The CropScan 3300H On Combine Analyser makes the generation of VRF maps simple, accurate and reliable. The ability to “dial in” a Yield Response to Nitrogen fertilizer ensures that the farmer can calculate the ROI for the VFR application. Table 2 shows the ROI of the CropScan 3300H based on the above field.
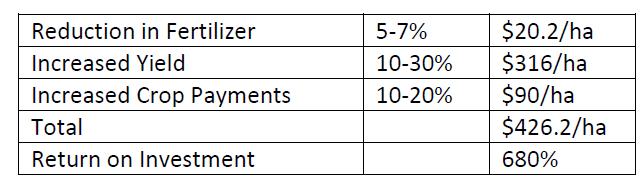
For an investment of $250,000 for VRA Technology, there are three profit mechanisms available.
- Reduction in fertilizer usage
- Increased yield
- Increase in crop payments based on quality (i.e., protein).
If the investment is expressed as per hectare, then for a 4,000-ha property, the investment in VRA Technology would be $62.5/ha. An estimate of the increased income using the CropScan 3300H to access these profit mechanisms is shown in the following table:
Discussion
The analysis above shows that the biggest return for farmers in using the CropScan 3300H to generate VRF prescription maps, lies in the potential to increase yield. Not every farm will realize such a significant increase in yield. The field shown above exhibits a high proportion as red and yellow zones. The majority of fields that have now been mapped with the CropScan 3300H protein and yield data show at least 20% of the field as being red and yellow zones. As such a more realistic return on investment is $120/ha.
The risk of not realizing an ROI is always in farmers’ minds. VRF prescriptions have been justified mostly on reduction in fertilizer till now. There is now a new tool available to farmers and their agronomists that provides a simpler means of developing VRF prescriptions. The Protein/Yield Correlation Quadrant Maps identify where and how much nitrogen fertilizer is required to achieve a positive yield response. With the emphasis more on increasing yield rather than just reducing fertilizer costs, this new approach to VRF can ensure a much higher return on VRA technology investments.
1. Grisso, Robert & Alley, Marcus & Thomason, Wade & Holshouser, D & Roberson, O.T.. (2011). Precision farming tools: Variable-rate application. Precision, Geospatial, & Sensor Technologies. 442-505.
2. Sawyer, J. E. 1994. Concepts of Variable Rate Technology with Considerations for Fertilizer Application. J. Prod. Agric. 7:195-201.
Subscribe Today For