Ag Retailer Buying Intentions Survey: Looking A Lot Like 2016
 January 2, 2017
 In the early 1970s, when reporters Bob Woodward and Carl Bernstein were first looking into what would become the Watergate Scandal, they were advised by insider “Deep Throat” to remember one very simple rule: Follow the money.
Here at CropLife® magazine, we thought this was a very good plan for us as well. So for the past few years, as a regular part of our annual State of the Industry report, we’ve conducted a Buying Intentions Survey of our readers. This offers a nice gauge into how ag retailers plan to spend their hard-earned revenues in the year ahead, as well as show what specific product categories might be the most popular based upon the agricultural market’s overriding trends.
Now in its 3rd year, the 2017 Buying Intentions survey was taken by 270 readers over the course of two weeks in late 2016. In it, respondents were asked if they planned to spend more money, less money, or the same amount across a host of product categories. Overall, “the same amount” seemed to be the most popular answer, but there were some segments that can expect to perform better than others.
The Fertilizer Outlook
For the fertilizer category, the past few years have been anything but kind, financially. According to information gathered in our annual CropLife 100 Survey, ag retailers saw their overall fertilizer incomes decline more than $1 billion during 2016 to $13.5 billion. Of course, some market watchers believed this drop had more to do with falling fertilizer prices than a decline in grower-customer demand, but a loss is still a loss.
The big question for 2017 is will fertilizer fortunes improve? For the two major sectors within the fertilizer category — dry and liquid — the answer seems to be “yes.”
According to the Buying Intentions Survey, 42% of ag retailers plan to increase their dry fertilizer spending in 2017 between 1% and more than 11%. This represents a 6% improvement from the figure the dry fertilizer sector recorded in the 2016 Buying Intentions Survey. Furthermore, the amount of money ag retailers plan to spend on dry fertilizer in 2017 will be up, with 27% of respondents planning to spend in excess of $10 million in this sector.
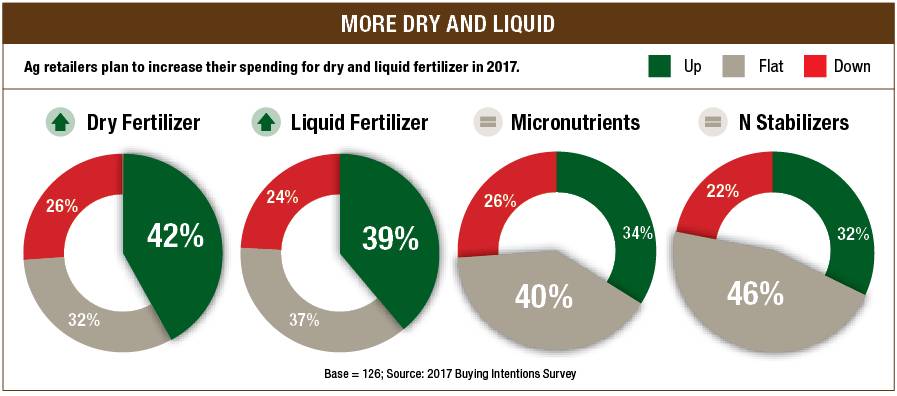
For the liquid fertilizer sector, the news is similar. Whereas 36% of respondents planned to spend more on this sector during 2016, that percentage has risen 3% to 39% for the 2017 Buying Intentions Survey. Likewise, 23% of these ag retailers expect to spend in excess of $10 million to fulfill the liquid fertilizer needs for their grower-customers during the year.
For the smaller fertilizer sectors, the news is a little less positive. For example, when it comes to spending more on micronutrients in 2017, only 34% of respondents say this will be the case. A slightly higher percentage — 40% — plan to spend the same amount of money on micronutrients in 2017 as they did in 2016.
This scenario is also expected to play out for nitrogen stabilizers as well. For this sector, only 32% of the 2017 Buying Intentions Survey respondents expect to spend more money during the upcoming year. A much higher percentage — 46% — will spend the same amount as during the prior year.
The Crop Protection Products Outlook
Unlike the fertilizer category, the crop protection products category experienced a decent year in 2016. For the year, CropLife 100 ag retailers saw sales in this segment drop less than half-a-percent from 2015, but still managed to top the $10 billion mark. And if the 3rd annual Buying Intentions Survey results are to be believed, this “push” scenario may again play out this year as well.
Take the insecticides sector, for instance. In the 2016 Buying Intentions Survey, 36% of respondents said they planned to spend more money for these products than during the prior year. But for 2017, however, the percentage of ag retailers planning to increase their insecticide buys has fallen to only 29%. More than half of those surveyed (51%) say they will spend exactly the same amount on insecticides this year.
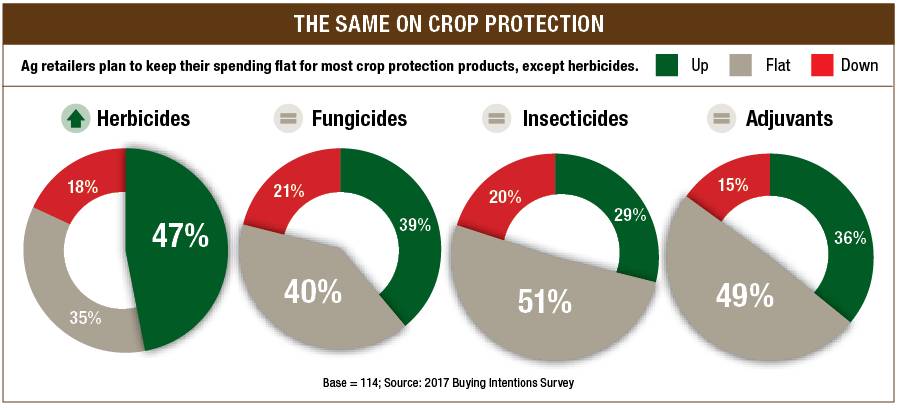
This same situation might also impact the fungicides sector. In 2016, 47% of survey respondents planned to increase their purchases in this area. However, for the 2017 survey, this percentage has dropped to 39%. A slightly larger number — 40% — plan to keep their fungicide product buys at the same level as in 2016.
Adjuvants, too, appear headed for this kind of market performance. Despite the fact that many new cropping systems and crop protection products are being used in the fields to combat pests and weeds, only 36% of Buying Intentions Survey respondents plan to increase spending in this sector. The majority — 49% — say their adjuvant purchases in 2017 will stay the same as they were in 2016.
The only exception to this “less spending for crop protection products in 2017” norm seems to come from the herbicides sector. According to results from the Buying Intentions Survey, 47% of respondents are planning to spend more money on these products during the upcoming season. Still, this is down 4% from 2016, when 51% of survey respondents planned to increase their spending in this sector.
The Seed Outlook
In 2016, the seed category had one of its best years ever. According to CropLife 100 ag retailers, their seed sales for the year improved almost 7% to top $4.6 billion. But if the results from the Buying Intentions Survey are correct, it could be much tougher for seed to continue down this winning path during 2017.
For purposes of the survey, four different seed sectors were tracked — corn, soybeans, wheat, and conventional seed. In 2017, the majority of respondents anticipate keeping their spending levels at exactly the same place they were in 2016 for three of these sectors. In corn seed, 36% of respondents plan to increase spending, with 39% planning to spend the same amount. In wheat, 43% of respondents are expecting to spend the same amount on seed as in 2016, with only 17% planning an increase. Finally, for conventional seed, 59% of respondents see their spending levels remaining flat, with only 23% planning an increase in this sector.
If there’s any hope for the seed category to keep improving upon its revenue numbers from 2016 in 2017, it just might come from the soybeans seed sector. Many of the new cropping systems that employ dicamba and 2,4-D resistance are first coming to the soybeans market, so more interest in this area seems to make sense. Also, the USDA is projecting soybean acreage in 2017 will top 85 million acres, whereas corn is projected to drop.
So when it comes to spending more money on soybean seeds in 2017, 56% of Buying Intentions Survey respondents say this will be the case for them. Only 31% plan to keep their soybean seed spending at their 2016 levels during the upcoming growing season.
The Equipment Outlook
While the fertilizer, crop protection products, and seed categories will apparently have their ups-and-downs by sector during 2017, the equipment category could have a much tougher time seeing increased spending for the year. Across virtually all product sectors being tracked in the 2017 survey — mixing/blending equipment, fertilizer spreaders, self-propelled sprayers, and precision agricultural equipment — a sizable majority of respondents plan to keep their spending for these products at the exact same levels as in 2016.
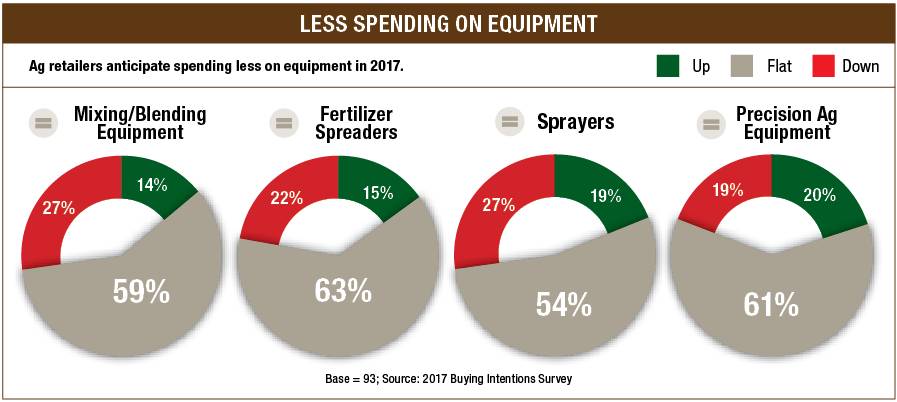
The highest percentage in this group — 63% — is in the fertilizer spreaders sector.
Perhaps more significantly, the second most popular spending option among respondents for the equipment category in the 2017 Buying Intentions Survey is to decrease spending. This holds true for respondents in the self-propelled sprayers sector (27%), the fertilizer spreaders sector (22%), and the mixing/blending equipment sector (27%).
The only exception here is in the precision agricultural products sector. Here, 61% of respondents plan to spend the same amount in 2017 as they did in 2016. However, slightly more plan to increase their spending for these products vs. decreasing their spending — 20% vs. 19%.
Subscribe Today For
